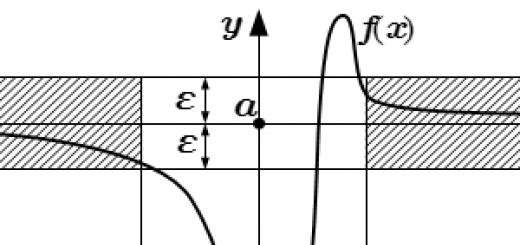
Various sense organs that give us information about the state of the surrounding world may be more or less sensitive to the phenomena they display, that is, they can reflect these phenomena with greater or lesser accuracy. The sensitivity of the sense organs is determined by the minimum stimulus that, under given conditions, is capable of causing a sensation.
The minimum strength of the stimulus that causes a barely noticeable sensation is called the lower absolute threshold of sensitivity. Irritants of lesser strength, the so-called subthreshold, do not cause sensations. The lower threshold of sensations determines the level of absolute sensitivity of this analyzer. Between the absolute sensitivity and the threshold value there is inverse relationship: The lower the threshold value, the higher the sensitivity of this analyzer. This ratio can be expressed by the formula E = 1/P, where E is the sensitivity, P is the threshold value.
Analyzers have different sensitivities. In humans, visual and auditory analyzers have very high sensitivity. As the experiments of S.I. Vavilov, the human eye is able to see light when only 2–8 quanta of radiant energy hit its retina. This allows you to see a burning candle on a dark night at a distance of up to 27 km.
The auditory cells of the inner ear detect movements whose amplitude is less than 1% of the diameter of a hydrogen molecule. Thanks to this, we hear the ticking of the clock in complete silence at a distance of up to 6 m. The threshold of one human olfactory cell for the corresponding odorous substances does not exceed 8 molecules. This is enough to smell in the presence of one drop of perfume in a room of 6 rooms. It takes at least 25,000 times more molecules to produce a taste sensation than it does to create an olfactory sensation. In this case, the presence of sugar is felt in a solution of one teaspoon of it per 8 liters of water.
The absolute sensitivity of the analyzer is limited not only by the lower, but also by the upper sensitivity threshold, i.e. maximum strength stimulus, in which there is still an adequate sensation to the acting stimulus. A further increase in the strength of stimuli acting on the receptors causes only pain sensations in them (such an effect is exerted, for example, by super-loud sound and blinding brightness).
The value of absolute thresholds depends on the nature of the activity, age, functional state of the organism, strength and duration of stimulation.
In addition to the magnitude of the absolute threshold, sensations are characterized by an indicator of a relative, or differential, threshold. The minimum difference between two stimuli that causes a barely noticeable difference in sensations is called the discrimination threshold, difference or differential threshold. The German physiologist E. Weber, testing a person's ability to determine the heavier of the two objects in the right and left hand, found that differential sensitivity is relative, not absolute. This means that the ratio of a barely noticeable difference to the magnitude of the initial stimulus is a constant value. The greater the intensity of the initial stimulus, the more it is necessary to increase it in order to notice a difference, i.e., the greater the magnitude of a barely noticeable difference.
The differential sensation threshold for the same organ is constant value and expressed the following formula: dJ/J = C, where J is the initial value of the stimulus, dJ is its increase, causing a barely perceptible sensation of a change in the value of the stimulus, and C is a constant. The value of the differential threshold for different modalities is not the same: for vision it is approximately 1/100, for hearing - 1/10, for tactile sensations - 1/30. The law embodied in the above formula is called the Bouguer-Weber law. It must be emphasized that it is valid only for medium ranges.
Based on the experimental data of Weber, the German physicist G. Fechner expressed the dependence of the intensity of sensations on the strength of the stimulus by the following formula: E = k * logJ + C, where E is the magnitude of sensations, J is the strength of the stimulus, k and C are constants. According to the Weber-Fechner law, the magnitude of sensations is directly proportional to the logarithm of the intensity of the stimulus. In other words, the sensation changes much more slowly than the strength of the stimulus grows. An increase in the strength of irritation in geometric progression corresponds to an increase in sensation in an arithmetic progression.
The sensitivity of analyzers, determined by the magnitude of absolute thresholds, changes under the influence of physiological and psychological conditions. A change in the sensitivity of the sense organs under the influence of the action of a stimulus is called sensory adaptation. There are three types of this phenomenon.
1. Adaptation as the complete disappearance of sensation in the process of prolonged action of the stimulus. It is a common fact that the sense of smell disappears distinctly shortly after we enter a room with an unpleasant odor. However, complete visual adaptation up to the disappearance of sensations under the action of a constant and motionless stimulus does not occur. This is due to the compensation of the immobility of the stimulus due to the movement of the eyes themselves. Constant voluntary and involuntary movements of the receptor apparatus ensure the continuity and variability of sensations. Experiments in which conditions were artificially created to stabilize the image relative to the retina (the image was placed on a special suction cup and moved along with the eye) showed that the visual sensation disappeared after 2–3 s.
2. Negative adaptation - dulling sensations under the influence of action strong irritant. For example, when we enter a brightly lit space from a semi-dark room, at first we are blinded and unable to distinguish any details around. After some time, the sensitivity of the visual analyzer decreases sharply and we begin to see. Another variant of negative adaptation is observed when the hand is immersed in cold water: in the first moments a strong cold stimulus acts, and then the intensity of sensations decreases.
3. Positive adaptation - increased sensitivity under the influence of a weak stimulus. In the visual analyzer, this is dark adaptation, when the sensitivity of the eyes increases under the influence of being in the dark. A similar form of auditory adaptation is silence adaptation.
Adaptation has a huge biological significance: it allows you to capture weak stimuli and protect the senses from excessive irritation in case of exposure to strong ones.
The intensity of sensations depends not only on the strength of the stimulus and the level of adaptation of the receptor, but also on the stimuli currently affecting other sense organs. A change in the sensitivity of the analyzer under the influence of other sense organs is called the interaction of sensations. It can be expressed both in an increase and in a decrease in sensitivity. The general pattern is that weak stimuli affecting one analyzer increase the sensitivity of another and, conversely, strong stimuli reduce the sensitivity of other analyzers when they interact. For example, accompanying the reading of a book with quiet, calm music, we increase the sensitivity and receptivity of the visual analyzer; too loud music, on the contrary, contributes to their lowering.
An increase in sensitivity as a result of the interaction of analyzers and exercises is called sensitization. The possibilities for training the sense organs and their improvement are very great. There are two areas that determine the increase in the sensitivity of the senses:
1) sensitization, which spontaneously leads to the need to compensate for sensory defects: blindness, deafness. For example, some deaf people develop vibrational sensitivity so strongly that they can even listen to music;
2) sensitization caused by activity, specific requirements of the profession. For example, high degree perfection is achieved by olfactory and gustatory sensations in tasters of tea, cheese, wine, tobacco, etc.
Thus, sensations develop under the influence of living conditions and the requirements of practical labor activity.
Bob Nelson
Most often, spectrum analyzers are used to measure very small signals. These may be known signals that need to be measured, or unknown signals that need to be detected. In any case, to improve this process, you should be aware of methods for increasing the sensitivity of the spectrum analyzer. In this article, we will discuss the optimal settings for measuring low level signals. In addition, we will discuss the use of noise correction and analyzer noise reduction functions to maximize instrument sensitivity.
Average self-noise and noise figure
The sensitivity of the spectrum analyzer can be found in its specifications. This parameter can be either average level own noise ( DANL), or noise figure ( NF). The average noise floor is the amplitude of the spectrum analyzer's noise floor over a given frequency range with a 50 ohm input load and 0 dB input attenuation. This parameter is usually expressed in dBm/Hz. In most cases, averaging is performed on a logarithmic scale. This reduces the displayed average noise level by 2.51 dB. As we will learn from the discussion below, it is this noise reduction that distinguishes the average noise floor from the noise figure. For example, if the analyzer specification specifies an average noise floor of 151 dBm/Hz with an IF filter bandwidth ( RBW) 1 Hz, then using the analyzer settings you can reduce the device's own noise level to at least this value. Incidentally, a CW signal that has the same amplitude as the spectrum analyzer noise will be measured 2.1 dB above the noise floor due to the summation of the two signals. Similarly, the observed amplitude of noise-like signals will be 3 dB higher than the noise floor.
The analyzer's inherent noise has two components. The first of them is determined by the noise figure ( NF ac), and the second is thermal noise. The thermal noise amplitude is described by the equation:
NF=kTB,
where k= 1.38×10⁻²³ J/K - Boltzmann's constant; T- temperature (K); B is the bandwidth (Hz) in which the noise is measured.
This formula determines the thermal noise energy at the input of a spectrum analyzer with a 50 Ω load. In most cases, the bandwidth is reduced to 1 Hz, and at room temperature the calculated value of thermal noise is 10log( kTB)= -174 dBm/Hz.
As a result, the value of the average level of intrinsic noise in the 1 Hz band is described by the equation:
DANL = –174+NF ac= 2.51 dB. (one)
Besides,
NF ac = DANL+174+2,51. (2)
Note. If for the parameter DANL rms power averaging is used, the term 2.51 can be omitted.
Thus, the value of the average level of self-noise –151 dBm/Hz is equivalent to the value NF ac= 25.5 dB.
Settings affecting the sensitivity of the spectrum analyzer
The gain of the spectrum analyzer is equal to one. This means that the screen is calibrated against the analyzer's input port. Thus, if a signal with a level of 0 dBm is applied to the input, the measured signal will be equal to 0 dBm plus/minus the instrument's error. This must be taken into account when using an input attenuator or amplifier in the spectrum analyzer. Turning on the input attenuator causes the analyzer to increase the equivalent gain of the IF stage to maintain the calibrated level on the screen. This, in turn, raises the noise floor by the same amount, thus maintaining the same signal-to-noise ratio. This is also true for an external attenuator. In addition, it is necessary to recalculate to the passband of the IF filter ( RBW) greater than 1 Hz by adding the term 10log( RBW/one). These two terms allow you to determine the noise floor of the spectrum analyzer when different meanings attenuation and resolution bands.
Noise level = DANL+ attenuation + 10log( RBW). (3)
Adding a preamp
The built-in or external preamplifier can be used to reduce the spectrum analyzer's inherent noise. Typically, datasheets will list a second value for the average noise floor, including the built-in preamp, and all of the above equations can be used. When using an external preamplifier, a new average noise floor can be calculated by cascading the noise figure equations and calculating the gain of the spectrum analyzer equal to one. If we consider a system consisting of a spectrum analyzer and an amplifier, we get the equation:
NF system = NF predus+(NF ac–1)/G predus. (4)
Using value NF ac= 25.5dB from the previous example, 20dB preamp gain and 5dB noise figure, we can determine the overall system noise figure. But first you need to convert the values to a ratio of powers and take the logarithm of the result:
NF system= 10log(3.16+355/100) = 8.27 dB. (five)
Now you can use Equation (1) to find a new value for the average noise floor with an external preamplifier by simply replacing NF ac on the NF system, calculated in equation (5). In our example, the preamp significantly reduces DANL-151 to -168 dBm/Hz. However, this is not given for free. Preamplifiers tend to have a lot of non-linearity and a low compression point, which limits the ability to measure high level signals. In such cases, the built-in preamp is more useful as it can be turned on and off as needed. This is especially true for automated control and measuring systems.
So far, we have discussed how the IF filter bandwidth, attenuator, and preamplifier affect the sensitivity of a spectrum analyzer. Most modern spectrum analyzers have methods for measuring their own noise and correcting the measurement results based on the acquired data. These methods have been used for many years.
Noise Correction
When measuring the characteristics of a certain device under test (DUT) with a spectrum analyzer, the observed spectrum is the sum of ktb, NF ac and input signal TU. If the DUT is turned off and a 50 Ohm load is connected to the analyzer input, the spectrum will be the sum ktb And NF ac. This trace is the analyzer's own noise. IN general case noise correction is to measure the spectrum analyzer's own noise with a large average and store this value as a "correction trace". You then connect the device under test to the spectrum analyzer, measure the spectrum, and record the results in the "measured trace". The correction is done by subtracting the "correction trace" from the "measured trace" and displaying the results as a "result trace". This trace is a "DOT signal" with no additional noise:
Resulting trace = measured trace - correction trace = [DOT signal + ktb + NF ac]–[ktb + NF ac] = TR signal. (6)
Note. All values were converted from dBm to mW before subtraction. The resulting trace is in dBm.
This procedure improves the display of low-level signals and allows for more accurate amplitude measurements by eliminating the error associated with the spectrum analyzer's inherent noise.
On fig. 1 shows a relatively simple method for correcting noise by applying trace math. First, the spectrum analyzer noise floor is averaged with input loading, the result is stored in trace 1. Then the DUT is connected, the input signal is captured, and the result is stored in trace 2. Now you can use math - subtracting two traces and putting the results in trace 3. How You see, noise correction is especially effective when the input signal is close to the spectrum analyzer's noise floor. High-level signals contain much less noise, and the correction does not have a noticeable effect.
The main disadvantage of this approach is that each time you change the settings, you have to turn off the device under test and connect a 50 ohm load. The method to obtain a "correction trace" without turning off the DUT is to increase the attenuation of the input signal (eg by 70 dB) so that the noise of the spectrum analyzer significantly exceeds the input signal, and store the results in the "correction trace". In this case, the "correction trace" is given by the equation:
Correction trace = TR signal + ktb + NF ac+ attenuator. (7)
ktb + NF ac+ attenuator >> TU signal,
we can omit the "signal TR" term and state that:
Correction trace = ktb + NF ac+ attenuator. (8)
By subtracting the known value of the attenuator from formula (8), we can get the original "correction trace" that was used in the manual method:
Correction trace = ktb + NF ac. (9)
In this case, the problem is that the "correction trace" is only valid for the current instrument settings. Changing settings such as center frequency, span, or IF filter bandwidth makes the values stored in the "correction trace" incorrect. The best approach is to know the values NF ac at all points of the frequency spectrum and the application of the "correction trace" at any setting.
Noise Reduction
The Agilent N9030A PXA signal analyzer (Figure 2) has a unique noise reduction (NFE) feature. The noise figure of the PXA signal analyzer over the entire frequency range of the instrument is measured during manufacture and calibration. This data is then stored in the instrument's memory. When the user turns on the NFE, the meter calculates a "correction trace" for the current settings and stores the noise figure values. This eliminates the need to measure the intrinsic noise of the PXA, as was done in the manual procedure, which greatly simplifies noise correction and saves time spent on measuring instrument noise when changing settings.

In any of the described methods, thermal noise is subtracted from the "measured trace" ktb And NF ac, which allows you to get results below the value ktb. These results may be reliable in many cases, but not in all. Confidence may decrease when the measured values are very close to or equal to the instrument's inherent noise. In fact, the result will be an infinite value in dB. A practical implementation of noise correction typically involves introducing a threshold or graduated subtraction level near the instrument's own noise floor.
Conclusion
We have considered some methods for measuring signals low level using a spectrum analyzer. At the same time, we found that the sensitivity of the measuring device is affected by the bandwidth of the IF filter, the attenuation of the attenuator and the presence of a preamplifier. For additional increase instrument sensitivity, methods such as mathematical noise correction and noise reduction can be applied. In practice, a significant increase in sensitivity can be achieved by eliminating losses in external circuits.
Despite the variety of types of sensations, there are some patterns common to all sensations. These include:
- the relationship between sensitivity and sensation thresholds,
- phenomenon of adaptation
- interaction of sensations and some others.
Sensitivity and thresholds of sensations. The sensation arises as a result of the action of an external or internal stimulus. However, for the sensation to occur, a certain strength of the stimulus is necessary. If the stimulus is very weak, it will not cause sensation. It is known that he does not feel the touch of dust particles on his face, does not see with his naked eyes the light of stars of the sixth, seventh, etc. magnitude. The minimum value of the stimulus at which a barely noticeable occurs is called the lower or absolute threshold of sensation. Irritants that act on human analyzers, but do not cause sensations due to low intensity, are called subthreshold. Thus, absolute sensitivity is the ability of the analyzer to respond to the minimum amount of stimulus.
Definition of sensitivity.
Sensitivity is the ability of a person to have sensations. The lower threshold of sensations is opposed by the upper threshold. It limits sensitivity on the other hand. If we go from the lower threshold of sensations to the upper one, gradually increasing the strength of the stimulus, then we will get a series of sensations of greater and greater intensity. However, this will be observed only up to a certain limit (up to the upper threshold), after which a change in the strength of the stimulus will not cause a change in the intensity of the sensation. It will still be the same threshold value or it will turn into a pain sensation. Thus, the upper threshold of sensations is called greatest strength stimulus, up to which a change in the intensity of sensations is observed, and sensations of this type are generally possible (visual, auditory, etc.).
Definition of sensitivity | Hypersensitivity | Sensitivity threshold | Pain sensitivity | Types of sensitivity | Absolute sensitivity
- High sensitivity
There is an inverse relationship between sensitivity and sensation thresholds. Special experiments have established that the absolute sensitivity of any analyzer is characterized by the value of the lower threshold: the lower the value of the lower threshold of sensations (the lower it is), the greater (higher) the absolute sensitivity to these stimuli. If a person smells very faint odors, this means that he has high sensitivity to them. The absolute sensitivity of the same analyzer varies among people. For some it is higher, for others it is lower. However, it can be improved through exercise.
- Increased sensitivity.
There are absolute thresholds of sensations not only in terms of intensity, but also in terms of quality of sensations. Thus, light sensations arise and change only under the action of electromagnetic waves certain length - from 390 ( purple) up to 780 millimicrons (red). Shorter and longer wavelengths do not cause light sensations. Auditory sensations in humans are possible only with vibrations sound waves ranging from 16 (lowest sounds) to 20,000 hertz (highest sounds).
In addition to the absolute thresholds of sensations and absolute sensitivity, there are also discrimination thresholds and, accordingly, distinctive sensitivity. The fact is that not every change in the magnitude of the stimulus causes a change in sensation. Within certain limits, we do not notice this change in the stimulus. Experiments have shown, for example, that when weighing a body by hand, an increase in a load of 500 g by 10 g and even 15 g will go unnoticed. To feel a barely noticeable difference in body weight, you need to increase (or decrease) the weight by 1/3 of its original value. This means that 3.3 g must be added to a load of 100 g and 33 g to a load of 1000 g. The discrimination threshold is the minimum increase (or decrease) in the magnitude of the stimulus that causes a barely noticeable change in sensations. Distinctive sensitivity is commonly understood as the ability to respond to changes in stimuli.
- Sensitivity threshold.
The threshold value depends not on the absolute, but on the relative magnitude of the stimuli: the greater the intensity of the initial stimulus, the more it must be increased in order to obtain a barely noticeable difference in sensations. This pattern is clearly expressed for sensations of medium intensity; sensations close to threshold have some deviations from it.
Each analyzer has its own discrimination threshold and its own degree of sensitivity. So, the threshold for distinguishing auditory sensations is 1/10, sensations of weight - 1/30, visual sensations - 1/100. From a comparison of the values, we can conclude that the visual analyzer has the greatest distinctive sensitivity.
The relationship between discrimination threshold and discrimination sensitivity can be expressed as follows: the lower the discrimination threshold, the greater (higher) distinctive sensitivity.
The absolute and differential sensitivity of analyzers to stimuli does not remain constant, but varies depending on a number of conditions:
a) from external conditions accompanying the main stimulus (in silence, hearing acuity increases, with noise it decreases); b) from the receptor (when it is tired, it decreases); c) on the state of the central departments of the analyzers; and d) on the interaction of the analyzers.
Adaptation of vision has been best studied experimentally (studies by S. V. Kravkov, K. Kh. Kekcheev, and others). There are two types of visual adaptation: dark adaptation and light adaptation. When moving from a lighted room into darkness, a person does not see anything for the first minutes, then the sensitivity of vision first slowly, then rapidly increases. After 45-50 minutes, we clearly see the outlines of objects. It has been proven that the sensitivity of the eyes can increase in the dark by 200,000 times or more. This phenomenon is called dark adaptation. When moving from darkness to light, a person also does not see clearly for the first minute, but then the visual analyzer adapts to the light. If at dark adaptation sensitivity vision increases, then with light adaptation it decreases. How brighter light, the lower the sensitivity of vision.
The same thing happens with auditory adaptation: with strong noise, the sensitivity of hearing decreases, in silence it increases.
- Pain sensitivity.
A similar phenomenon is observed in the olfactory, skin and taste sensations. The general pattern can be expressed as follows: under the action of strong (and even more prolonged) stimuli, the sensitivity of the analyzers decreases; under the action of weak stimuli, it increases.
However, adaptation is poorly expressed in pain sensations, which has its own explanation. pain sensitivity arose in the process of evolutionary development as one of the forms of protective adaptation of the organism to environment. Pain alerts the body to danger. Lack of pain sensitivity could lead to irreversible destruction and even death of the body.
Adaptation is also very weakly expressed in kinesthetic sensations, which again is biologically justified: if we did not feel the position of our arms and legs, we would get used to it, then control over body movements in these cases would have to be carried out mainly through vision, which is not economically.
Physiological mechanisms of adaptation are processes occurring both in the peripheral organs of the analyzers (in receptors) and in the cerebral cortex. For example, the photosensitive substance of the retinas of the eyes (visual purple) disintegrates under the action of light, and is restored in the dark, which leads in the first case to a decrease in sensitivity, and in the second to its increase. At the same time, cortical nerve cells also occur according to the laws.
The interaction of sensations. In sensations different types there is an interaction. Sensations of a certain type are intensified or weakened under the influence of sensations of other types, while the nature of the interaction depends on the strength of side sensations. Let us give an example of the interaction of auditory and visual sensations. If, during continuous sound, relatively loud sound alternately illuminate and darken the room, the sound will seem louder in the light than in the dark. There will be an impression of "beating" of the sound. In this case, the visual sensation increased the sensitivity of hearing. However, blinding light lowers auditory sensitivity.
Melodious quiet sounds increase the sensitivity of vision, deafening noise lowers it.
Special studies have shown that the sensitivity of the eye in the dark increases under the influence of light muscular work (raising and lowering the arms), increased breathing, rubbing the forehead and neck with cool water, and weak taste stimuli.
In the sitting position, the sensitivity of night vision is higher than in the standing and lying positions.
Hearing sensitivity is also higher in a sitting position than in a standing and lying position.
The general pattern of the interaction of sensations can be formulated as follows: weak stimuli increase sensitivity to other, simultaneously acting stimuli, while strong stimuli reduce it.
The processes of interaction sensation proceed in. An increase in the sensitivity of the analyzer under the influence of weak stimuli from other analyzers is called sensitization. During sensitization, the summation of excitations in the cortex occurs, the focus of optimal excitability of the main analyzer under given conditions is strengthened due to weak excitations from other analyzers (dominant phenomenon). The decrease in the sensitivity of the leading analyzer under the influence of strong stimuli from other analyzers is explained by the well-known law of simultaneous negative induction.