Laboratory work № 1
Observation of the effect of a magnetic field on current
Objective: make sure that a uniform magnetic field has an orienting effect on the current-carrying loop.
Equipment: coil-coil, tripod, direct current source, rheostat, key, connecting wires, arcuate or strip magnet.
Note. Before work, make sure that the rheostat slider is set to maximum resistance.
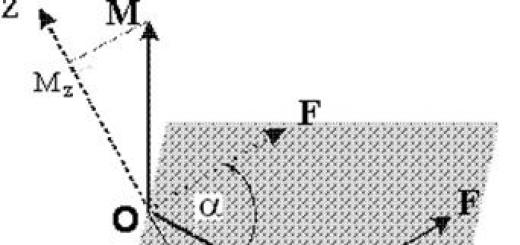
In 1820, H. Oersted discovered the action electric current on _____ In 1820, A. Ampere established that two parallel conductors with a current _____ A magnetic field can be created: a) _____ b) _____ c) _____ What is the main characteristic magnetic field? What are the units in the SI system? For the direction of the magnetic induction vector B in the place where the frame with the current is located, take _____ What is the peculiarity of the lines of magnetic induction? The gimlet rule allows _____ The Ampère force formula looks like this: F= _____ Formulate the rule of the left hand. The maximum torque M acting on the frame with current from the magnetic field depends on _____
Working process
Assemble the chain according to the drawing, hanging it on flexible wires
spool.
Position the arcuate magnet under some sharp
angle α (for example, 45 °) to the plane of the coil-coil and, closing the key, observe the movement of the coil-coil.
Repeat the experiment, first changing the poles of the magnet, and then the direction of the electric current. Draw a coil-coil and a magnet, indicating the direction of the magnetic field, the direction of the electric current and the nature of the movement of the coil-coil .. Explain the behavior of the coil-coil with current in a uniform magnetic field. Position the arcuate magnet in the plane of the coil (α=0°). Repeat the steps in steps 2-5. Position the arcuate magnet perpendicular to the plane of the spool (α=90°). Repeat the steps in steps 2-5.
Conclusion: _____
Additional task
By changing the current strength with a rheostat, observe whether the nature of the movement of the coil-coil with current in a magnetic field changes?
Lab #2
Studying the phenomenon of electromagnetic induction
Objective: study the phenomenon electromagnetic induction, check Lenz's rule.
Equipment: milliammeter, power supply, coils with cores, arcuate or strip magnet, rheostat, key, connecting wires, magnetic needle.
Training tasks and questions
August 28, 1831 M. Faraday _____ What is the phenomenon of electromagnetic induction? The magnetic flux Ф through a surface with an area S is called _____ In what units in the SI system are measureda) magnetic field induction [B]= _____
b) magnetic flux[F]= _____
5. Lenz's rule allows you to determine _____
6. Write down the formula for the law of electromagnetic induction.
7. What is physical meaning law of electromagnetic induction?
8. Why is the discovery of the phenomenon of electromagnetic induction classified as greatest discoveries in physics?
Working process
Connect the coil to the clamps of the milliammeter. Do the following:
a) insert the north (N) pole of the magnet into the coil;
b) stop the magnet for a few seconds;
c) remove the magnet from the coil (the modulus of the speed of the magnet is approximately the same).
3. Write down whether an induction current occurred in the coil and what are its features in each case: a) _____ b) _____ c) _____
4. Repeat step 2 with the south (S) pole of the magnet and draw the appropriate conclusions: a) _____ b) _____ c) _____
5. Formulate under what condition an induction current appeared in the coil.
6. Explain the difference in the direction of the induced current in terms of Lenz's rule
7. Draw a diagram of the experience.
8. Draw a circuit consisting of a current source, two coils on common core, key, rheostat and milliammeter (connect the first coil to the milliammeter, connect the second coil through the rheostat to the current source).
9. Gather electrical circuit according to this scheme.
10. Closing and opening the key, check whether there is an induction current in the first coil.
11. Check the implementation of the Lenz rule.
12. Check if an induction current occurs when the rheostat current changes.
Lab #3
Determining the Acceleration of Free Fall Using a Pendulum
Objective: calculate the gravitational acceleration and evaluate the accuracy of the result.
Equipment: watch with second hand, measuring tape, ball with hole, thread, tripod with clutch and ring.
Training tasks and questions
Free oscillations are called _____ Under what conditions can a thread pendulum be considered mathematical? The period of oscillation is _____ In what units in the SI system are measured:
a) period [T]= _____
b) frequency [ν]= _____
c) cyclic frequency[ω]= _____
d) oscillation phase[ϕ]= _____
5. Write down the formula for the period of oscillation mathematical pendulum obtained by G. Huygens.
6. Write down the equation oscillatory motion in differential form and its solution.
7. The cyclic oscillation frequency of the pendulum is 2.5π rad/s. Find the period and frequency of the pendulum.
8. The equation of motion of the pendulum has the form x=0.08 sin 0.4πt. Determine the amplitude, period and frequency of oscillations.
Working process
Place a tripod on the edge of the table, fasten the ring at its upper end with a coupling and hang the ball on the thread to it. The ball should hang at a distance of 2-5 cm from the floor. Measure the length of the pendulum with a tape: ℓ= _____ Deviate the pendulum from the equilibrium position by 5-8 cm and release it. Measure the time of 30-50 complete oscillations (eg N=40). t₁ = _____ Repeat the experiment 4 more times (the number of oscillations in all experiments is the same).
t= _____ t
t ![]() https://pandia.ru/text/78/010/images/image009_84.gif" width="65" height="44">
https://pandia.ru/text/78/010/images/image009_84.gif" width="65" height="44"> ![]() ________ .
________ .
Enter the results of calculations and measurements in the table.
q ![]() q__________
q__________
Calculate the absolute time measurement errors in each experiment.
∆t₁=|t₁−thttps://pandia.ru/text/78/010/images/image012_63.gif" width="15" height="25 src=">|=| |=
∆t₃=|t₃−thttps://pandia.ru/text/78/010/images/image012_63.gif" width="15" height="25 src=">|=| |=
∆t₅=|t₅−thttps://pandia.ru/text/78/010/images/image012_63.gif" width="15" height="25"> = ![]()
![]() = _______
= _______
Calculate relative error measurements q by the formula:
![]() , where = 0.75 cm
, where = 0.75 cm ![]()
Calculate the absolute measurement error q.
https://pandia.ru/text/78/010/images/image012_63.gif" width="15" height="25">± ∆q. q = _____ q = _____ Compare the result with the value of 9.8 m / s².
Lab #4
Measurement of the refractive index of glass
Objective: Calculate the refractive index of glass relative to air.
Equipment: a trapezoid-shaped glass plate, a power source, a key, a light bulb, connecting wires, a metal screen with a slot.
Training tasks and questions
The refraction of light is a phenomenon _____ Why do fingers dipped into water seem short? Why does light pass from turpentine to glycerin without refraction? What is the physical meaning of the refractive index? What is the difference between a relative refractive index and an absolute one? Write down the formula for the law of refraction of light. When is the angle of refraction equal to the angle of incidence? At what angle of incidence α is the reflected beam perpendicular to the refracted beam? (n is the relative refractive index of the two media)
Working process
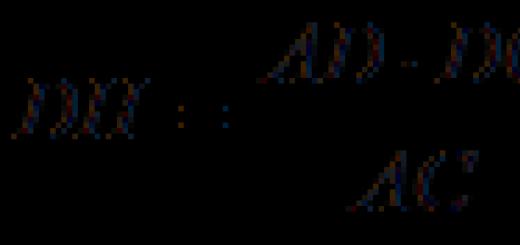
Connect the light bulb through the switch to the power source. Use a screen with a slit to get a thin beam of light. Position the plate so that the light beam falls on it at point B under some acute angle. Put two points along the light beam falling on the plate and coming out of it. Turn off the light bulb and remove the plate, outlining its outline. Draw the incident and refracted rays through point B of the air-glass interface and mark the angles of incidence α and refraction β. Draw a circle centered at point B and mark the intersection points of the circle with the incident and reflected rays (points A and C, respectively). Measure the distance from point A to the perpendicular to the interface. α= ____ Measure the distance from point C to the perpendicular to the interface. b= _____ Calculate the refractive index of glass using the formula.
https://pandia.ru/text/78/010/images/image025_24.gif" width="67" height="44 src="> n= n= _____
Calculate the relative error in the measurement of the refractive index using the formula:
Where ∆α = ∆b = 0.15 cm. ______ = _____
11. Calculate the absolute measurement error n.
∆n = n εhttps://pandia.ru/text/78/010/images/image031_22.gif" width="16" height="24 src=">= n ± ∆n. n= _____
13. Enter the results of calculations and measurements in the table.
14. Repeat measurements and calculations at a different angle of incidence.
15. Compare the obtained results of the refractive index of glass with the table.
Additional task
Measure the angles α and β with a protractor. Find from the table sin α=_____, sin β= _____. Calculate the refractive index of glass n= n= _____ Evaluate the result.
Lab #5
Determination of the optical power and focal length of a converging lens.
Objective: determine the focal length and optical power of a converging lens.
Equipment: ruler, two right triangle, a long focus converging lens, a light bulb on a stand with a cap containing a letter, a current source, a key, connecting wires, a screen, a guide rail.
Training tasks and questions
A lens is called _____ A thin lens is _____ Show the course of rays after refraction in a converging lens.


Write down the formula for a thin lens. The optical power of the lens is _____ D= ______ How will the focal length of the lens change if its temperature rises? Under what condition is the image of an object obtained with a converging lens is imaginary? The light source is placed in the double focus of a converging lens, the focal length of which is F = 2 m. At what distance is its image from the lens? Construct an image in a converging lens.


Describe the resulting image.
Working process
1 Assemble the electrical circuit by connecting the light bulb to a power source through a switch.
2. Place the light bulb on one end of the table and the screen on the other end. Place a converging lens between them.
3. Turn on the bulb and move the lens along the rod until a sharp, reduced image of the luminous letter of the bulb cap is obtained on the screen.
4. Measure the distance from the screen to the lens in mm. d=
5. Measure the distance from the lens to the image in mm. f
6. With d unchanged, repeat the experiment 2 more times, each time getting a sharp image again. f ![]() , f
, f ![]()
7. Calculate the average distance from the image to the lens.
fhttps://pandia.ru/text/78/010/images/image041_14.gif" width="117" height="41"> f= _______
8. Calculate the optical power of the lens D D
9. Calculate the focal length to the lens. F F=
Equipment: a diffraction grating with a period of mm or mm, a tripod, a ruler with a holder for the grating and a black screen with a slit in the middle that can move along the ruler, .
Training tasks and questions
The dispersion of light is called _____ The interference of light waves is _____ Formulate the Huygens-Fresnel principle. The diffraction grating is _____ The maxima of the diffraction grating occur under the condition _____ grating with a period d=2 μm, a monochromatic wave of light falls normally. Determine the wavelength if k=4. Why are particles smaller than 0.3 microns not visible in an optical microscope? Does the position of the illumination maxima produced by a diffraction grating depend on the number of slits? Calculate the path difference of monochromatic light waves (λ=6·10 m) incident on the diffraction grating and forming a second-order maximum.
Working process
Turn on the light source. Looking through the diffraction grating and the slit in the screen at the light source and moving the grating in the holder, set it so that the diffraction spectra are parallel to the screen scale. Install the screen approximately 50 cm from the grille. Measure the distance from the grating to the screen. α= _____ Measure the distance from the screen slit to the first order red line to the left and right of the slit.
Left: b = _____ Right: b=_____
Calculate the red wavelength to the left of the slit in the screen.
Calculate the red wavelength to the right of the slit in the screen.
Calculate the average value of the red wavelength.
https://pandia.ru/text/78/010/images/image058_7.gif" width="117" height="45 src=">0" style="border-collapse:collapse;border:none">
Location
to the right of
Violet
to the right of
Laboratory work in physics for the course of the 11th grade.
Lab #1
OBSERVATION OF THE ACTION OF THE MAGNETIC FIELD ON THE CURRENT
Equipment: coil of wire, tripod, direct current source, rheostat, key, connecting wires, arched magnet.
Hang the coil of wire from a tripod, connect it to a current source in series with the rheostat and the key. The key must first be open, the rheostat motor set to maximum resistance.
Conducting an experiment
1. Bring a magnet to the hanging skein and, closing the key, observe the movement of the skein.
2. Choose several characteristic options for the relative position of the coil and the magnet and sketch them, indicating the direction of the magnetic field, the direction of the current and the expected movement of the coil relative to the magnet.
3. Verify by experience the correctness of the assumptions about the nature and direction of movement of the skein.
Lab #2
STUDYING THE PHENOMENON OF ELECTROMAGNETIC INDUCTION
Equipment : milliammeter, power supply, coils with cores, arcuate magnet, push-button switch, connecting wires, magnetic needle (compass), rheostat.
Preparing for work
1. Insert an iron core into one of the coils, securing it with a nut. Connect this coil through a milliammeter, a rheostat and a key to a power source. Close the key and use a magnetic needle (compass) to determine the location of the magnetic poles of the current coil. Fix in which direction the arrow of the milliammeter deviates. In the future, when performing work, it will be possible to judge the location of the magnetic poles of the coil with current in the direction of deviation of the arrow of the milliammeter.
2. Disconnect the rheostat and the key from the circuit, close the milliammeter to the coil, keeping the order of connecting their terminals.
Conducting an experiment
1. Attach the core to one of the poles of the arcuate magnet and slide it inside the coil, simultaneously observing the milliammeter needle.
2. Repeat the observation by moving the core out of the coil and also by changing the poles of the magnet.
3. Draw a diagram of the experiment and check the implementation of Lenz's rule in each case.
4. Position the second coil next to the first so that their axes match.
5. Insert iron cores into both coils and connect the second coil through the switch to the power source.
6. Closing and opening the key, observe the deviation of the milliammeter needle.
7. Draw a diagram of the experiment and check the implementation of Lenz's rule.
Lab #3
DETERMINATION OF FREE-FALL ACCELERATION USING A PENDULUM
Equipment:
clock with a second hand, measuring tape with an error of L = 0.5 cm, a ball with a hole, a thread, a tripod with a sleeve and a ring.
Preparing for work
A variety of gravimeters, in particular pendulum devices, are used to measure the acceleration of free fall. With their help, it is possible to measure the acceleration of free fall with an absolute error of the order of 10 -5 m/s 2 .
The work uses the simplest pendulum - a ball on a thread. With small ball sizes compared to the length of the thread and small deviations from the equilibrium position, the period of oscillation is equal to the period of oscillation of a mathematical pendulum. To increase the accuracy of the period measurement, it is necessary to measure the time t sufficiently a large number N complete oscillations of the pendulum. Then the period T = , and the acceleration of free fall can be
calculated by the formula

Conducting an experiment
1. Place a tripod on the edge of the table. At its upper end, strengthen the ring with a coupling and hang the ball on the thread to it. The ball should hang at a distance of 1-2 cm from the floor.
2. Measure the length I of the pendulum with a tape (the length of the pendulum must be at least 50 cm).
3. Excite the oscillations of the pendulum by deflecting the ball to the side by 5-8 cm and releasing it.
4. Measure the time t 50 of oscillation of the pendulum in several experiments and calculate
![]() where n is the number of time measurements.
where n is the number of time measurements.
5. Calculate the mean absolute time measurement error

6. Calculate the free fall acceleration using the formula
![]()
7. Determine the relative error of time measurement t.
8. Determine the relative error of measuring the length of the pendulum. The value l is the sum of the error of the measuring tape and the reading error, equal to half the division value of the tape:
l \u003d l l + l paternal.
9. Calculate the relative measurement error g using the formula
![]()
given that the rounding error l can be neglected if = 3.14; l can also be neglected if it is 4 times (or more) less than 2 t .
10. Determine g = q g cp and write the result of the measurement as

Make sure the measurements are valid and check that the known value of g belongs to the obtained interval.
Lab #4
MEASURING THE REFRACTIVE INDEX OF GLASS
Equipment required measurements. The paper measures the refractive index of a glass plate shaped like a trapezoid. A narrow light beam is directed obliquely to one of the parallel faces of the plate. Passing through the plate, this beam of light experiences a double refraction. The light source is an electric bulb connected through a key to a current source. The light beam is created using a metal screen with a slit. In this case, the width of the beam can be changed by changing the distance between the screen and the light bulb.
The refractive index of glass relative to air is determined by the formula
where is the angle of incidence of the light beam on the edge of the plate (from air to glass); - the angle of refraction of the light beam in the glass.
To determine the ratio on the right side of the formula, proceed as follows. Before directing a light beam at the plate, it is placed on a table on a sheet of graph paper (or a sheet of paper in a cage) so that one of its parallel faces coincides with the previously marked line on the paper. This line will indicate the air-glass interface. With a finely sharpened pencil, draw a line along the second parallel edge. This line represents the glass-air interface. After that, without shifting the plate, a narrow light beam is directed to its first parallel face at some angle to the face. Points 1, 2, 3 and 4 are placed along the light beams falling on the plate and emerging from it with a finely sharpened pencil (Fig. 18.r. After that, the light is turned off, the plate is removed and the incoming, outgoing and refracted rays are drawn with a ruler (Fig. 18.2) Through point B of the air-glass interface, draw a perpendicular to the boundary, mark the angles of incidence and refraction... Then, using a compass, draw a circle centered at point B and build right-angled triangles ABE and CBD.
The lengths of the segments AE and DC are measured on graph paper or with a ruler. In both cases, the instrumental error can be considered equal to 1 mm. The reading error must also be taken equal to 1 mm to take into account the inaccuracy in the location of the ruler relative to the edge of the light beam.
The maximum relative error in measuring the refractive index is determined by the formula
The maximum absolute error according to the formula is determined
(Here n pr is the approximate value of the refractive index, determined by formula (18.1).)
The final result of the measurement of the refractive index is written as follows:
Preparing for work
2. Connect the light bulb through the switch to the power source. Use a screen with a slit to get a thin beam of light.
1. Measure the refractive index of glass relative to air at some angle of incidence. Write down the measurement result taking into account the calculated errors.
2. Repeat the same at a different angle of incidence.
3. Compare the results obtained by the formulas
4. Make a conclusion about the dependence (or independence) of the refractive index on the angle of incidence. (The method for comparing measurement results is described in the introduction to laboratory work in a physics textbook for grade X.)
Security Question
To determine the refractive index of glass, it is enough to measure the angles and with a protractor and calculate the ratio of their sines. Which of the methods for determining the refractive index is preferable: this one or the one used in the work?
Lab #5
DETERMINATION OF THE OPTICAL POWER AND FOCAL LENGTH OF A CONVERSING LENS
Equipment
: ruler, two right-angled triangles, long focus converging lens, light bulb on a stand with a cap, current source, switch, connecting wires, screen, guide rail.
Preparing for work
The simplest way to measure the refractive power and focal length of a lens is to use the lens formula
As an object, a letter glowing with diffused light in the cap of the illuminator is used. The actual image of this letter is obtained on the screen.
Conducting an experiment
1. Assemble the electrical circuit by connecting the light bulb to a current source through a switch.
2. Place the light bulb on the edge of the table and the screen on the other edge. Place a lens between them, turn on the light and move the lens along the rail until a sharp image of a luminous letter is obtained on the screen.
To reduce the measurement error associated with focusing, it is advisable to obtain a smaller (and therefore brighter) image.
3. Measure the distances d and f, paying attention to the need for careful reading of the distances.
With d unchanged, repeat the experiment several times, each time again obtaining a sharp image. Calculate f cf, D cf, F cf. Enter the results of distance measurements (in millimeters) in the table.
4. The absolute error D of measuring the optical power of the lens can be calculated by the formula , where 1 and 2 are the absolute errors in the measurement of d and f.
When determining 1 and 2, it should be borne in mind that the measurement of the distances d and f cannot be carried out with an error less than half the thickness of the lens h.
Since the experiments are carried out at a constant d, then 1 =. The measurement error f will be greater due to the inaccuracy of sharpening by about another . So
5. Measure the thickness of the lens h (Fig. 18.3) and calculate D using the formula
6. Record the result in the form
Lab #6
MEASUREMENT OF LIGHT WAVE LENGTH
Equipment required measurements. In this work, to determine the length of a light wave, a diffraction grating with a period of mm or - mm is used (the period is indicated on the grating). It is the main part of the measurement setup shown in Figure 18.4. The grate 1 is installed in the holder 2, which is attached to the end of the line 3. On the line there is a black screen 4 with a narrow vertical slot 5 in the middle. The screen can move along the ruler, which allows you to change the distance between it and the diffraction grating. There are millimeter scales on the screen and ruler. The entire setup is mounted on a tripod 6.
If you look through the grating and the slot at the light source (an incandescent lamp or a candle), then on the black background of the screen you can observe diffraction spectra of the 1st, 2nd, etc. orders on both sides of the slit.
The wavelength is determined by the formula
where d is the grating period; k is the order of the spectrum; - the angle at which the maximum light of the corresponding color is observed.
Since the angles at which the maxima of the 1st and 2nd orders are observed do not exceed 5°, one can use their tangents instead of the sines of the angles. Figure 18.5 shows that
The distance a is measured along the ruler from the grating to the screen, the distance b is measured along the screen scale from the slit to the selected spectrum line.
The final formula for determining the wavelength is
In this work, the measurement error of wavelengths is not estimated due to some uncertainty in the choice of the middle part of the spectrum of a given color.
Preparing for work
1. Prepare a report form with a table to record the results of measurements and calculations.
2. Assemble the measuring setup, install the screen at a distance of 50 cm from the grid.
3. Looking through the diffraction grating and the slit in the screen at the light source and moving the grating in the holder, set it so that the diffraction spectra are parallel to the screen scale.
Conducting an experiment, processing measurement results
1. Calculate the wavelength of the red color in the 1st order spectrum to the right and left of the slit in the screen, determine the average value of the measurement results.
2. Do the same for the field color.
3. Compare your results with the red and violet wavelengths in fig. V, 1 color insert.
Lab #7
Observation of interference, diffraction and polarization of light
goal of the work: experimental observation of the phenomenon of interference and diffraction of light.
theoretical part: interference of light waves - the addition of two waves, as a result of which a stable pattern of amplification or weakening of the resulting light vibrations at various points in space is observed in time. the result of interference depends on the angle of incidence on the film, its thickness and wavelength. gain light will happen in the event that the refracted one lags behind the reflected one by an integer number of wavelengths. if the second wave lags behind the first by half a wavelength, or by an odd number of half-waves, then the light will be attenuated. diffraction is the bending of waves around the edges of obstacles.
equipment: glass plates - 2 pieces, nylon or cambric patches, illuminated film with a slit made with a razor blade, gramophone record, caliper, lamp with a straight filament.
conclusion of the work done:
1. light interference
having carried out an experiment on observing the interference of light with the help of two plates, we noticed that with a change in pressure, the shape and arrangement of the interference fringes change. This is due to the fact that when the film thickness changes, the wave path difference changes. highs change to lows and vice versa. with transmitted light, the interference pattern cannot be observed, since this requires matched waves with the same lengths and a constant phase difference. It is impossible to obtain an interference pattern using two independent light sources. turning on one more bulb only increases the illumination, but does not create an alternation of min and max illumination.
2. diffraction
using various methods, we observed the phenomenon of light diffraction, the change in diffraction spectra. this work is an experimental confirmation of the theory of light diffraction.
Observe the blue sky through a polaroid with the line of sight approximately at right angles to the direction of the Sun (light scattered at right angles to the direction of the incident light is most strongly polarized). Gently rotate the polaroid and watch the change in apparent brightness blue sky. The change in brightness caused by the polarization of scattered light is especially noticeable if, against a blue sky, white clouds appear in the field of view, the brightness of which does not change when the polaroid is rotated.
Lab #8
OBSERVATION OF CONTINUOUS AND LINE SPECTRA
Equipment:
projector, spectral tubes with hydrogen, neon or helium, high-voltage inductor, power supply, tripod, connecting wires (these devices are common to the whole class), a glass plate with beveled edges (given to each).
Conducting an experiment
1. Place the plate horizontally in front of the eye. Through the edges making an angle of 45°, observe a light vertical strip on the screen - the image of the sliding slit of the projection apparatus.
2. Select the primary colors of the resulting continuous spectrum and write them down in the observed sequence.
3. Repeat the experiment, examining the strip through the faces forming an angle of 60°. Record the differences as spectra.
4. Observe the line spectra of hydrogen, helium or neon by viewing the luminous spectral tubes through the edges of a glass plate. Record the brightest lines of the spectra.
Security Question
What is the difference between a diffraction spectrum and a dispersion spectrum?
Lab #9
Studying the tracks of charged particles from ready-made photographs
| The progress of the laboratory experiment: goal of the work: In this work, it is required to carry out the identification of a charged particle based on the results of comparing its track with the proton track in a cloud chamber placed in a magnetic field. |
Objective:
Equipment:
Note.
Working process
spool.
Conclusion: _____
Additional task
Lab #2
Studying the phenomenon of electromagnetic induction
Objective: study the phenomenon of electromagnetic induction, check Lenz's rule.
Equipment: milliammeter, power supply, coils with cores, arcuate or strip magnet, rheostat, key, connecting wires, magnetic needle.
Training tasks and questions
- August 28, 1831 M. Faraday _____
- What is the phenomenon of electromagnetic induction?
- The magnetic flux Ф through a surface with an area S is called _____
- What units are used in the SI system?
a) magnetic field induction [B]= _____
b) magnetic flux [F] = _____
5. Lenz's rule allows you to determine _____
6. Write down the formula for the law of electromagnetic induction.
7. What is the physical meaning of the law of electromagnetic induction?
8. Why is the discovery of the phenomenon of electromagnetic induction classified as one of the greatest discoveries in the field of physics?
Working process
- Connect the coil to the terminals of the milliammeter.
- Do the following:
a) insert the north (N) pole of the magnet into the coil;
b) stop the magnet for a few seconds;
c) remove the magnet from the coil (the modulus of the speed of the magnet is approximately the same).
3. Write down whether an induction current occurred in the coil and what are its features in each case: a) _____ b) _____ c) _____
4. Repeat step 2 with the south (S) pole of the magnet and draw the appropriate conclusions: a) _____ b) _____ c) _____
5. Formulate under what condition an induction current appeared in the coil.
6. Explain the difference in the direction of the induced current in terms of Lenz's rule
7. Draw a diagram of the experience.
8. Draw a circuit consisting of a current source, two coils on a common core, a key, a rheostat and a milliammeter (connect the first coil to the milliammeter, connect the second coil through the rheostat to the current source).
9. Assemble the electrical circuit according to this diagram.
10. Closing and opening the key, check whether there is an induction current in the first coil.
11. Check the implementation of the Lenz rule.
12. Check if an induction current occurs when the rheostat current changes.
Lab #3
Working process
- Place a tripod on the edge of the table, fasten the ring at its upper end with a coupling and hang the ball on the thread to it. The ball should hang at a distance of 2-5 cm from the floor.
- Measure the length of the pendulum with a tape: ℓ= _____
- Deviate the pendulum from the equilibrium position by 5-8 cm and release it.
- Measure the time of 30-50 complete oscillations (eg N=40). t₁ = _____
- Repeat the experiment 4 more times (the number of oscillations in all experiments is the same).
t = _____ t = _____ t = _____ t = _____
- Calculate the average value of the oscillation time.
t ![]() ,
,
t ![]() t__________ .
t__________ .
- Calculate the average value of the oscillation period.
![]() ________ .
________ .
- Enter the results of calculations and measurements in the table.
q ![]() q __________
q __________
- Calculate the absolute time measurement errors in each experiment.
∆t₁=|t₁−t |=| |=
∆t₂=|t₂−t |=| |=
∆t₃=|t₃−t |=| |=
∆t₄=|t₄−t |=| |=
∆t₅=|t₅−t |=| |=
- Calculate the mean absolute error of time measurements.
∆t = ![]()
![]() = _______
= _______
- Calculate the relative measurement error q using the formula:
![]() , where = 0.75 cm
, where = 0.75 cm ![]()
- Calculate the absolute measurement error q.
∆q = _____ ∆q = _____
Lab #4
Working process
- Connect the light bulb through the switch to the power source. Use a screen with a slit to get a thin beam of light.
- Position the plate so that the light beam falls on it at point B at some sharp angle.
- Put two points along the light beam falling on the plate and coming out of it.
- Turn off the light bulb and remove the plate, outlining its outline.
- Draw the incident and refracted rays through point B of the air-glass interface and mark the angles of incidence α and refraction β.
- Draw a circle centered at point B and mark the intersection points of the circle with the incident and reflected rays (points A and C, respectively).
- Measure the distance from point A to the perpendicular to the interface. α=____
- Measure the distance from point C to the perpendicular to the interface. b= _____
- Calculate the refractive index of glass using the formula.
Because n= n= _____
- Calculate the relative error in the measurement of the refractive index using the formula:
Where ∆α = ∆b = 0.15 cm. ______ = _____
11. Calculate the absolute measurement error n.
∆n = n ε ∆n = ______ ∆n = _____
12. Write the result as n = n ± ∆n. n = _____
13. Enter the results of calculations and measurements in the table.
| experience number | α, cm | B cm | n | ∆α, cm | ∆b, cm | ε | ∆n |
14. Repeat measurements and calculations at a different angle of incidence.
15. Compare the obtained results of the refractive index of glass with the table.
Additional task
Lab #5
Working process
1 Assemble the electrical circuit by connecting the light bulb to a power source through a switch.
2. Place the light bulb on one end of the table and the screen on the other end. Place a converging lens between them.
3. Turn on the bulb and move the lens along the rod until a sharp, reduced image of the luminous letter of the bulb cap is obtained on the screen.
4. Measure the distance from the screen to the lens in mm. d=
5. Measure the distance from the lens to the image in mm. f
6. With d unchanged, repeat the experiment 2 more times, each time getting a sharp image again. f ![]() , f
, f
7. Calculate the average distance from the image to the lens.
f ![]() f
f ![]() f = _______
f = _______
8. Calculate the optical power of the lens D D
9. Calculate the focal length to the lens. F F =
10. Enter the results of calculations and measurements in the table.
| experience number | f 10¯³, m | f, m | d, m | D , diopter | D, diopter | F, m |
11. Measure lens thickness in mm. h=_____
12. Calculate the absolute error in measuring the optical power of the lens using the formula:
∆D = , ∆D = _____
13. Write the result as D = D ± ∆D D = _____
Lab #6
Working process
- Turn on the light source.
- Looking through the diffraction grating and the slit in the screen at the light source and moving the grating in the holder, set it so that the diffraction spectra are parallel to the screen scale.
- Install the screen approximately 50 cm from the grille.
- Measure the distance from the grating to the screen. α= _____
- Measure the distance from the screen slit to the red first order line to the left and right of the slit.
Left: b = _____ Right: b=_____
- Repeat measurements and calculations for purple.
Observation of the effect of a magnetic field on current
Objective: make sure that a uniform magnetic field has an orienting effect on the current-carrying loop.
Equipment: coil-coil, tripod, direct current source, rheostat, key, connecting wires, arcuate or strip magnet.
Note. Before work, make sure that the rheostat slider is set to maximum resistance.
Training tasks and questions
- In 1820, H. Oersted discovered the effect of electric current on _____
- In 1820, A. Ampere established that two parallel conductors with a current _____
- A magnetic field can be created: a) _____ b) _____ c) _____
- What is the main characteristic of a magnetic field? What are the units in the SI system?
- For the direction of the magnetic induction vector B in the place where the frame with current is located, take _____
- What is the feature of magnetic induction lines?
- The gimlet rule allows _____
- Ampère's force formula is: F= _____
- State the left hand rule.
- The maximum torque M acting on the frame with current from the magnetic field depends on _____
Working process
- Assemble the chain according to the drawing, hanging it on flexible wires
spool.
- Position the arcuate magnet under some sharp
angle α (for example, 45 °) to the plane of the coil-coil and, closing the key, observe the movement of the coil-coil.
- Repeat the experiment, first changing the poles of the magnet, and then the direction of the electric current.
- Draw a coil and a magnet, indicating the direction of the magnetic field, the direction of the electric current and the nature of the movement of the coil.
- Explain the behavior of a current-carrying coil in a uniform magnetic field.
- Position the arcuate magnet in the plane of the coil (α=0°). Repeat the steps in steps 2-5.
- Position the arcuate magnet perpendicular to the plane of the spool (α=90°). Repeat the steps in steps 2-5.
Conclusion: _____
Additional task
- By changing the current strength with a rheostat, observe whether the nature of the movement of the coil-coil with current in a magnetic field changes?
Lab #2
Equipment: tripod with clutch and foot, power source, wire coil, arcuate magnet, key, connecting wires.
Work Instructions
1. Assemble the installation shown in Figure 144, b. By bringing a magnet to the wire coil, close the circuit. Pay attention to the nature of the magnetic interaction of the coil and the magnet.

2. Bring the magnet to the skein with the other pole. How has the nature of the interaction between the coil and the magnet changed?
3. Repeat the experiments, placing the magnet on the other side of the skein.
4. Position the wire coil between the poles of the magnet as shown in Figure 144, a. After closing the circuit, observe the phenomenon. Draw your own conclusions.

In work No. 4, we will consider the interaction of a solenoid with a magnet. As you know, a magnetic field arises in a solenoid under current, which will interact with a permanent magnet. We will carry out a series of four experiments with different arrangements of the coil and magnet. It should be expected that their interaction will also be different (attraction or repulsion).
Approximate work progress:
We observe the following phenomena, which are conveniently represented in the form of figures:

Laboratory work No. 11. Observation of the phenomenon of interference and diffraction of light.
The purpose of the work: to experimentally study the phenomenon of interference and diffraction of light, to identify the conditions for the occurrence of these phenomena and the nature of the distribution of light energy in space.
Equipment: an electric lamp with a straight filament (one per class), two glass plates, a PVC tube, a glass with a soap solution, a wire ring with a handle with a diameter of 30 mm., a blade, a strip of paper ¼ sheet, nylon fabric 5x5 cm, a diffraction grating, light filters .
Brief theory
Interference and diffraction are phenomena characteristic of waves of any nature: mechanical, electromagnetic. Wave interference is the addition of two (or several) waves in space, in which at its different points an amplification or weakening of the resulting wave is obtained. Interference is observed when superimposing waves emitted by the same light source, which came to given point different ways. For the formation of a stable interference pattern, coherent waves are needed - waves that have the same frequency and a constant phase difference. Coherent waves can be obtained on thin films of oxides, fat, on an air wedge-gap between two transparent glasses pressed against each other.
The amplitude of the resulting displacement at point C depends on the difference in the path of the waves at a distance d2 – d1.
[ Download the file to view the picture ] Maximum-(amplification of oscillations) condition: the difference in the path of the waves is equal to an even number of half-waves
where k=0; ± 1; ±2; ± 3;
[ Download the file to view the picture ] Waves from sources A and B will come to point C in the same phases and “amplify each other.
If the path difference is equal to an odd number of half-waves, then the waves will weaken each other and a minimum will be observed at the point of their meeting.
[ Download the file to view the image ][ Download the file to view the image ]
When light interferes, a spatial redistribution of the energy of light waves occurs.
Diffraction is the phenomenon of wave deviation from rectilinear propagation when passing through small holes and rounding small obstacles by the wave.
Diffraction is explained by the Huygens-Fresnel principle: each point of the obstacle that the wave has reached becomes a source of secondary waves, coherent, which propagate beyond the edges of the obstacle and interfere with each other, forming a stable interference pattern - alternating illumination maxima and minima, iridescently colored in white light. Condition for the manifestation of diffraction: The dimensions of the obstacles (holes) must be smaller than or commensurate with the wavelength. Diffraction is observed on thin filaments, scratches on glass, on a slit-vertical cut in a sheet of paper, on eyelashes, on water droplets on misted glass, on ice crystals in a cloud or on glass, on the bristles of the chitinous cover of insects, on bird feathers, on CDs, wrapping paper., On a diffraction grating.,
A diffraction grating is an optical device, which is a periodic structure of a large number of regularly arranged elements on which light is diffracted. Strokes with a profile defined and constant for a given diffraction grating are repeated through the same interval d (lattice period). The ability of a diffraction grating to decompose a beam of light incident on it into wavelengths is its main property. There are reflective and transparent diffraction gratings. In modern devices, mainly reflective diffraction gratings are used.
Working process:
Task 1. A) Observation of interference on a thin film:
Experience 1. Dip the wire ring in the soap solution. A soap film is formed on the wire ring.
Position it vertically. We observe light and dark horizontal stripes that change in width and color as the film thickness changes. Examine the picture through a light filter.
Write down how many bands are observed and how the colors alternate in them?
Experience 2. Using a PVC tube, blow a soap bubble and examine it carefully. When illuminated with white light, observe the formation of interference spots, painted in spectral colors. Examine the picture through a light filter.
What colors are visible in the bubble and how do they alternate from top to bottom?
B) Observation of interference on the air wedge:
Experience 3. Carefully wipe two glass plates, put together and squeeze with your fingers. Due to the non-ideality of the shape of the contacting surfaces, the thinnest air voids are formed between the plates - these are air wedges, interference occurs on them. When the force compressing the plates changes, the thickness of the air wedge changes, which leads to a change in the location and shape of the interference maxima and minima. Then examine the picture through a light filter.
Draw what you see in white light and what you see through a filter.
Conclude: Why interference occurs, how to explain the color of the maxima in the interference pattern, which affects the brightness and color of the picture.
Task 2. Observation of light diffraction.
Experience 4. With a blade we cut a slit in a sheet of paper, apply the paper to our eyes and look through the slit at the light source-lamp. We observe the maxima and minima of illumination. Then examine the picture through a light filter.
Sketch the diffraction pattern seen in white light and in monochromatic light.
Deforming the paper, we reduce the width of the slit, we observe diffraction.
Experience 5. Consider a light source-lamp through a diffraction grating.
How has the diffraction pattern changed?
Experience 6. Look through the nylon fabric at the thread of a luminous lamp. Turning the fabric around the axis, achieve a clear diffraction pattern in the form of two diffraction bands crossed at a right angle.
Sketch the observed diffraction cross. Explain this phenomenon.
Make a conclusion: why diffraction occurs, how to explain the color of the maxima in the diffraction pattern, what affects the brightness and color of the picture.
Test questions:
What is common between the phenomenon of interference\erence and the phenomenon of diffraction?
What waves can give a stable interference pattern?
Why is there no interference pattern on the student table from lamps suspended from the ceiling in the classroom?
6. How to explain the colored circles around the moon?
Attached files