Topic: General repetition of the course of mathematics. Exam preparation
Lesson: Reading a graph of functions. Problem solving B2
In our life, graphs are quite common, take, for example, a weather forecast, which is presented as a graph of changes in any indicators, for example, temperature or wind strength over time. We don't think twice when we read this graph, even though it may be the first reading of a graph in our lives. You can also give an example of a graph of changes in exchange rates over time and many other examples.
So, the first graph that we will consider.
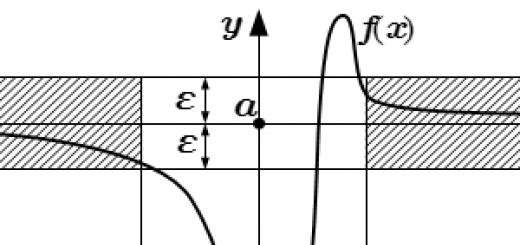
Rice. 1. Graph illustration 1
As you can see, the graph has 2 axes. The axis facing right (horizontal) is called the axis ![]() . The axis looking up (vertical) is called the axis
. The axis looking up (vertical) is called the axis ![]() .
.
First, let's take a look at the axis. On this graph, along this axis, the number of revolutions per minute for a certain automobile engine is plotted. It can be equal, etc. There are also divisions on this axis, some of them are indicated by numbers, some of them are intermediate and not marked. It is easy to guess that the first division from zero is, the third is, etc.
Now let's take a look at the axis. On this chart, along this axis, numerical values Newton values per meter (), torque values that are equal, etc. In this case, the division value is .
Now let's turn to the function itself (to the line that is presented on the chart). As you can see, this line reflects how many Newtons per meter, that is, what torque, will be at a specific value of engine revolutions per minute. If we take the value of 1000 rpm. and from this point on the graph we will go to the left, then we will see that the line passes through point 20, i.e. the torque value at 1000 rpm will be equal to (Figure 2.2).
If we take the value of 2000 rpm, then the line will pass already at the point (Figure 2.2).

Rice. 2. Determination of torque by the number of revolutions per minute
Now imagine that our task is to find the largest value from this graph. We are looking for the most high point(), respectively, the lowest value of the torque in this graph will be considered 0. To find the highest value of the function on the graph, you need to consider the highest value that the function reaches on the vertical axis. We look at which value is highest, and look on the vertical axis at what will be the largest number achieved. If we are talking about the smallest value, then we take, on the contrary, the lowest point and look at its value along the vertical axis.

Rice. 3. The largest and smallest value of the function according to the graph
The largest value in this case is , and the smallest value, respectively, is 0. It is important not to confuse and indicate the maximum value correctly, some indicate the maximum value of 4000 rpm, this is not the largest value, but the point at which the largest value is taken (point maximum), the largest value is exactly .
You should also pay attention to the vertical axis, its units of measurement, that is, for example, if instead of Newtons per meter () hundreds of Newtons per meter () would be indicated, the maximum value would need to be multiplied by one hundred, etc.
The largest and smallest value of a function are very closely related to the derivative of the function.
If the function increases on the segment under consideration, then the derivative of the function on this segment is positive or equal to zero at a finite number of points, most often simply positive. Similarly, if the function decreases on the segment under consideration, then the derivative of the function on this segment is negative or equal to zero at a finite number of points. The converse statement is true in both cases.
The following example has some difficulties with the constraint on the horizontal axis. It is necessary to find the largest and smallest value on the specified segment.
The graph shows the change in temperature over time. On the horizontal axis we see time and days, and on the vertical axis we see temperature. It is necessary to determine the highest air temperature on January 22, i.e. we need to consider not the entire graph, but the part relating to January 22, i.e. from 00:00 January 22 to 00:00 January 23.

Rice. 4. Graph of temperature change
By limiting the graph, it becomes obvious to us that the maximum temperature corresponds to the point .
A schedule of temperature changes for three days is set. On the ox axis - the time of day and day of the month, on the oy axis - the value of air temperature in degrees Celsius.
We need to consider not the entire schedule, but the part relating to July 13, i.e. from 00:00 July 13 to 00:00 July 14.

Rice. 5. Illustration for an additional example
If you do not enter the restrictions described above, you can get an incorrect answer, but on a given interval the maximum value is obvious: , and it is reached at 12:00 on July 13.
Example 3: determine on what date five millimeters of precipitation first fell:
The graph shows the daily amount of precipitation in Kazan from February 3 to February 15, 1909. The days of the month are plotted horizontally, and the amount of precipitation in millimeters is plotted vertically.

Rice. 6. Daily precipitation
Let's start in order. On the 3rd, we see that a little more than 0 fell out, but less than 1 mm. precipitation, 4 mm of precipitation fell on the 4th, etc. For the first time, the number 5 appears on the 11th day. For convenience, it was possible to virtually draw a straight line opposite the five, for the first time it will cross the chart exactly on February 11, this is the correct answer.
Example 4: Determine what day the price of an ounce of gold was the lowest
The chart shows the price of gold at the close of trading for each day from March 5 to March 28, 1996. The days of the month are plotted horizontally, and the days of the month are plotted vertically.
respectively, the price of an ounce of gold in US dollars.
The lines between the points are drawn only for clarity, the information is carried exclusively by the points themselves.

Rice. 7. Graph of changes in the price of gold on the stock exchange
Additional example: determine at which point of the segment the function takes on the largest value:
The derivative of some function is given on the graph.

Rice. 8. Illustration for an additional example
The derivative is defined on the interval
As you can see, the derivative of the function on a given interval is negative, and it is equal to zero at the left boundary point. As we know, if the derivative of the function is negative, then the function decreases on the interval under consideration, therefore, our function decreases on the entire segment under consideration, in this case, it takes on the largest value in the leftmost boundary. Answer: dot.
So, we examined the concept of a function graph, studied what the axes on a graph are, how to find the value of a function from a graph, how to find the largest and smallest value.
- Mordkovich A.G. Algebra and beginning of mathematical analysis. - M.: Mnemosyne.
- Muravin G.K., Muravina O.V. Algebra and beginning of mathematical analysis. - M.: Bustard.
- Kolmogorov A.N., Abramov A.M., Dudnitsyn Yu.P. Algebra and the beginning of mathematical analysis. - M.: Enlightenment.
- USE ().
- Festival of Pedagogical Ideas ().
- Studying is easy. RF ().
- The diagram (Figure 9) shows the average monthly air temperature in Yekaterinburg (Sverdlovsk) for each month in 1973. Months are indicated horizontally, temperatures in degrees Celsius are indicated vertically. Determine from the diagram the lowest average monthly temperature in the period from May to December 1973 inclusive. Give your answer in degrees Celsius.

Rice. 9. Graph of temperature change
- Using the same graph (Figure 9), determine the difference between the highest and lowest average monthly temperatures in 1973. Give your answer in degrees Celsius.
- The graph (Figure 10) shows the process of warming up an internal combustion engine at an ambient temperature of 15 degrees. The abscissa shows the time in minutes elapsed since the engine was started, the ordinate shows the engine temperature in degrees Celsius. A load can be connected to the engine when the engine temperature reaches 45 degrees. What is the least number of minutes you need to wait before connecting the load to the motor?

Rice. 10. Engine warm-up schedule
slide 12
Symmetry about the line y=x
The graphs of these functions increase when a > 1 and decrease at 0
slide 13
One of the figures shows a graph of the function y=2-x. Specify this picture. Schedule exponential function The graph of the exponential function passes through the point (0, 1). Since the base of the degree is less than 1, this function must be decreasing.
Slide 14
One of the figures shows a graph of the function y=log5 (x-4). Specify the number of this chart. Schedule logarithmic function y=log5x passes through the point (1;0), then if x -4 =1, theny=0, x=1+4, x=5. (5;0) – point of intersection of the graph with the OX axis If x -4 = 5, then y=1, x=5+4, x=9, Graph of the logarithmic function 9 5 1
slide 15
The function y=f(x) is defined on the interval (-6;7). The figure shows a graph of the derivative of this function. All tangents are drawn to the graph of the function, parallel to the straight line y=5-2x (or coinciding with it). Specify the number of points in the graph of the function where these tangents are drawn. K = tga = f’(xo) By condition k=-2. Therefore f’(xo)=-2 We draw a straight line y=-2. It intersects the graph at two points, which means that the tangents to the function are drawn at two points. Finding the number of tangents to the graph of a function from the graph of its derivative
slide 16
The function y=f(x) is defined on the interval [-7;3]. The figure shows a graph of its derivative. Find the number of points in the graph of the function y=f(x) where the tangents to the graph are parallel to the x-axis or coincide with it. Slope lines parallel to the abscissa axis or coinciding with it is equal to zero. Therefore K=tg a = f `(xo)=0 The OX axis intersects this chart at four points. Finding the number of tangents to a function from the graph of its derivative
Slide 17
The function y=f(x) is defined on the interval (-6;6). The figure shows a graph of its derivative. Find the number of points on the graph of the function y=f(x) at which the tangents to the graph are inclined at an angle of 135ok to the positive direction of the x-axis. K = tg 135o= f'(xo) tg 135o=tg(180o-45o)=-tg45o=-1 Therefore f`(xo)=-1 carried out in triplets. Finding the number of tangents to a function from the graph of its derivative
Slide 18
The function y=f(x) is defined on the interval[-2;6]. The figure shows a graph of the derivative of this function. Specify the abscissa of the point at which the tangent to the graph of the function y=f(x) has the smallest angular coefficient k=tg a=f’(xo) The derivative of the function takes the smallest value y=-3 at the point x=2. Therefore, the tangent to the graph has the smallest slope at the point x \u003d 2 Finding the slope of the tangent from the graph of the derivative of the function -3 2
Slide 19
The function y=f(x) is defined on the interval [-7;3]. The figure shows a graph of the derivative of this function. Specify the abscissa of the day, in which the tangent to the graph of the function y=f(x) has the largest slope. k \u003d tg a \u003d f '(xo) Therefore, the tangent to the graph has the largest slope at the point x \u003d -5 Finding the slope of the tangent from the graph of the derivative of the function 3 -5
Slide 20
The figure shows a graph of the function y \u003d f (x) and a tangent to it at a point with the xo abscissa. Find the value of the derivative f `(x) at the point xo f ’(xo) \u003d tg a Since in the figure a is an obtuse angle, then tg a
slide 21
Finding the minimum (maximum) of a function from the graph of its derivative
At the point x=4, the derivative changes sign from minus to plus. Meanx=4 is the minimum point of the function y=f(x) 4 At points x=1, the derivative changes sign from the plus sign. minus Valuex=1 is the maximum point of the function y=f(x))
slide 22
Independent work
Fig.11) Find the scope of the function. 2) Solve the inequality f(x) ≥ 0 3) Determine the intervals of decreasing function. Fig.2-graph of the derivative of the function y=f(x) 4) Find the minimum points of the function. 5) Specify the abscissa of the point where the tangent to the graph of the function y=f(x) has the largest slope. Fig.11) Find the range of the function. 2) Solve the inequality f(x)≤ 0 3) Determine the intervals of increasing function. Fig.2-graph of the derivative of the function y=f(x) 4) Find the maximum points of the function. 5) Specify the abscissa of the point at which the tangent to the graph of the function y=f(x) has the smallest slope. 1 Option 2 Option
TOPIC "READING THE GRAPH OF A DERIVATIVE FUNCTION"
The purpose of the lesson: the formation of skills and abilities to determine the properties of the derivative according to the graph of the function, the properties of the function according to the graph of the derivative, to compare the graph of the function and the graph of its derivative.
Materials and equipment: computer presentation.
Lesson plan
- Organizing time.
- Mental account "Catch the mistake"
- Repetition of theoretical material on the topic "Own support"
- Skill development
- Game "Competence"
- Summarizing.
During the classes.
- Organizing time. In the course of studying the topic “Investigation of functions using the derivative”, the skills were formed to find critical points of a function, a derivative, to determine the properties of a function with its help and build its graph. Today we will look at this topic from a different angle: how to determine the properties of the function itself through the graph of the derivative of a function. Our task: to learn how to navigate the variety of USE tasks related to graphs of functions and their derivatives.
- Verbal counting
(2x 2) / \u003d 2x; (3x-x 3) / \u003d 3-3x; X / =1 X
- Repetition of theoretical material on the topic. (draw a man in a notebook, indicating the mood at the beginning of the lesson)
Let's repeat some properties of the function: increase and decrease, extrema of the function.
A sufficient sign of an increase (decrease) of a function. It says:
- If the derivative of a function is positive at every point in the interval X, then the function is increasing in the interval X.
- If the derivative of a function is negative at every point in the interval X, then the function is decreasing in the interval X.
Sufficient conditions for an extremum:
Let the function y=f(x) be continuous on the interval X and have a critical point x 0 inside the interval. Then if, when passing through the point x 0, the derivative:
a) changes sign from “+” to “-”, then x 0 is the maximum point of the function,
b) changes sign from "-" to "+", then x 0 is the minimum point of the function,
c) does not change sign, then at the point x 0 there is no extremum.
The derivative of a function is itself a function. So she has her own schedule.
X(we have a segment [ a; b]) is located above the x-axis, then the function increases on this interval.
If the graph of the derivative on the interval X located below the x-axis, then the function decreases on this interval. Moreover, the variants of the graphs of the derivative can be different.
So, having a graph of the derivative of a function, we can conclude about the properties of the function itself.
- Skill development. Consider the problem:
- Game "Competence"
- Summarizing. (draw a little man in a notebook, indicating the mood at the end of the lesson) The role of “summing up” (he will say what thought (conclusion, result ...) was, in his opinion, the main one in the lesson)
Download:
Preview:
To use the preview of presentations, create a Google account (account) and sign in: https://accounts.google.com
Slides captions:
READING A GRAPH OF A DERIVATIVE FUNCTION and whether on the way to the exam
Lesson plan Organizational moment. Oral counting “Catch the mistake” Repetition of theoretical material on the topic, summary “Own support” Skill development Game “Competence” Summing up.
Mental counting "Find the mistake" (2x 2) / \u003d x (3x-x 3) / \u003d 3-3 2 4 x 2 - -5
Repetition of theoretical material on the topic f(x) f / (x) 5 + – y = f / (x) 1 2 3 4 5 6 7 - 7 - 6 - 5 -4 -3 -2 -1 4 3 2 1 - 1 -2 -3 -4 -5 y x + 1 Sufficient sign of increasing (decreasing) function: If the derivative of the function is positive at each point of the interval X, then the function increases on the interval X. If the derivative of the function is negative at each point of the interval X, then the function decreases on the interval X. If the graph of the derivative on the interval X is located above the x-axis, then the function increases on this interval. If the graph of the derivative on the interval X is located below the x-axis, then the function decreases on this interval.
f(x) f / (x) 5 + – y = f / (x) 1 2 3 4 5 6 7 - 7 - 6 -5 -4 - 3 -2 - 1 4 3 2 1 -1 -2 -3 -4 -5 y x + 1 "Own support" Increasing Decreasing Increasing
f (x) f / (x) 5 + - y \u003d f / (x) y x + 1 E maximum of the function, b) changes sign from “-” to “+”, then x 0 is the minimum point of the function, c) does not change sign, then there is no extremum at the point x 0. Repetition of theoretical material on the topic “Own support” A necessary condition for the existence of an extremum: If the function y \u003d f (x) has an extremum at the point x \u003d x 0, then at this point the derivative is either equal to 0 or does not exist. max min
Skill development (solving problems from the open bank of the Unified State Examination) increasing intervals: (-5; -1), (2; 8), (11; 12) Answer: 6 1 f (x) f / (x) + + +
Skill development Decreasing intervals: (-1; 0), (9; 12) Answer: 3 2 f(x) f / (x) – – Skill development (solving problems from the open USE bank)
Skill development Answer: -3 3 f(x) f / (x) Skill development (solving problems from the open USE bank)
Skill development Answer: - 3 4 f(x) f / (x) Skill development (solving problems from the open USE bank)
Skill development 5 f(x) f / (x) Skill development (solving problems from the open USE bank)
Game " Competence" Participants: two teams - competing firms Teams come up with 3 tasks for each other on the topic of the lesson, exchange tasks, complete them and show the solution on the board. If the opponent fails, then the team asking the question must answer it themselves. Each firm evaluates the work of a competing firm on a 5-point system (each task and each answer) Sponsors of knowledge: Petrova Gelena and Semenova Kunney
Summing up We draw a little man Summing up: what was the main thing in the lesson? what was interesting? what have you learned? Grading criteria: 28-30 points - grade "5" 20-27 points - grade "4" 10-19 points - grade "3" below 10 points - recommendation for hard work in preparing for the exam
General lesson on the topic:
"Using the derivative and its graph to read the properties of a function"
Lesson type: a generalizing lesson using ICT in the form of a presentation.
Lesson Objectives:
Educational:
To promote the assimilation by students of the use of the derivative in practical tasks;
To teach students to clearly use the properties of a function and a derivative.
Developing:
Develop the ability to analyze the question of the task and draw conclusions;
Develop skills to apply existing knowledge in practical tasks.
Educational:
Raising interest in the subject;
The need for these theoretical and practical skills to continue your studies.
Lesson objectives:
Develop specific skills and abilities for working with a graph of the derivative of a function for their use when passing the exam;
Prepare for the test.
Lesson plan.
1. Actualization of basic knowledge (AKB).
2. Development of knowledge, skills and abilities on the topic.
3. Testing (B8 from the exam).
4. Mutual verification, grading the "neighbor".
5. Summing up the lessons of the lesson.
Equipment: computer class, whiteboard, marker, tests (2 options).
During the classes.
Organizational moment.
Teacher . Hello, have a seat.
In the course of studying the topic “Investigation of functions using the derivative”, the skills were formed to find critical points of a function, a derivative, to determine the properties of a function with its help and build its graph. Today we will look at this topic from a different angle: how to determine the properties of the function itself through the graph of the derivative of a function. Our task: to learn to navigate in a variety of tasks related to graphs of functions and their derivatives.
In preparation for the exam in mathematics in KIMs, tasks were given for using the derivative graph to study functions. Therefore, in this lesson, we must systematize our knowledge on this topic and learn how to quickly find answers to the questions of tasks B8.
Slide number 1.
Subject: "Application of the derivative and its graph to read the properties of functions"
Lesson objectives:
Development of the ZUN of the use of the derivative, its geometric meaning and the graph of the derivative to determine the properties of functions.
Development of the efficiency of performing USE tests.
The education of such personality traits as attentiveness, the ability to work with text, the ability to work with a derivative graph
2. Actualization of basic knowledge (AKB). Slides #4 to #10.
Questions will now appear on the screen for repetition. Your task: to give a clear and concise answer to each item. The correctness of your answer can be checked on the screen.
( The question first appears on the screen, after the students' answers, the correct answer appears for verification.)
List of questions for AOP.
Definition of a derivative.
geometric sense derivative.
The relationship between the values of the derivative, the slope of the tangent, the angle between the tangent and the positive direction of the OX axis.
Application of the derivative to find intervals of monotonicity of a function.
Application of the derivative to determine critical points, extremum points
6 .Necessary and sufficient conditions for an extremum
7 . Using the derivative to find the largest and the smallest value functions
(Students answer each item, accompanying their answers with notes and drawings on the board. With erroneous and incomplete answers, classmates correct and supplement them. After the students answer, the correct answer appears on the screen. Thus, students can immediately determine the correctness of their answer. )
3. Development of knowledge, skills and abilities on the topic. Slides #11 to #15.
Students are offered assignments from the KIMs of the Unified State Examination in mathematics of past years, from sites on the Internet on the use of the derivative and its graph to study the properties of functions. Tasks appear sequentially. Students write their solutions on the board or verbally. Then the correct solution appears on the slide and is checked against the students' solution. If a mistake is made in the decision, then it is analyzed by the whole class.
Slide #16 and #17.
Further in the class, it is advisable to consider the key task: according to the graph of the derivative, the students must come up with (of course, with the help of the teacher) various questions related to the properties of the function itself. Naturally, these issues are discussed, if necessary, corrected, summarized, recorded in a notebook, after which the stage of solving these tasks begins. Here it is necessary to ensure that students not only give the correct answer, but are able to argue (prove) it, using the appropriate definitions, properties, rules.
Testing (B8 from the exam). Slides from number 18 to number 29. Slide number 30 - the keys to the test.
Teacher : So, we summarized your knowledge on this topic: we repeated the basic properties of the derivative, solved problems related to the derivative graph, analyzed the complex and problematic aspects of using the derivative and the derivative graph to study the properties of functions.
Now we will test in 2 options. Tasks will appear on the screen both options, simultaneously. You study the question, find the answer, enter it in the answer sheet. After completing the test, exchange forms and check the work of a neighbor according to ready-made answers. Rating(up to 10 points - "2", from 11 to 15 points - "3", from 16 to 19 points - "4", more than 19 points - "5".).
Summing up the lesson
We have considered the relationship between the monotonicity of a function and the sign of its derivative, and sufficient conditions for the existence of an extremum. We considered various tasks for reading the graph of the derivative of a function that are found in the texts of a single state exam. All the tasks we have considered are good in that they do not take much time to complete.
During the unified state exam, it is very important to write down the answer quickly and correctly.
Submit answer sheets. The grade for the lesson is already known to you and will be put in the journal.
I think the class is ready for the test.
Homework will be creative . slide number 33 .
Elements of mathematical analysis in the Unified State Examination Malinovskaya Galina Mikhailovna [email protected] Reference material Table of derivatives of the main functions. Differentiation rules (derivative of sum, product, quotient of two functions). Derivative of a complex function. The geometric meaning of the derivative. physical meaning derivative. Reference material Extremum points (maximum or minimum) of a function given graphically. Finding the largest (smallest) value of a function that is continuous on a given interval. An antiderivative of a function. Newton-Leibniz formula. Finding the area of a curvilinear trapezoid. Physical applications 1.1 Material point moves rectilinearly according to the law 𝑥 𝑡 = −𝑡 4 +6𝑡 3 +5𝑡 + 23 , where x is the distance from the reference point in meters, t is the time in seconds measured from the beginning of the movement. Find its speed (in meters per second) at time t= 3s. 1.2 The material point moves 1 3 rectilinearly according to the law 𝑥 𝑡 = 𝑡 − 3 3𝑡 2 − 5𝑡 + 3 , where x is the distance from the reference point in meters, t is the time in seconds, measured from the beginning of the movement. At what point in time (in seconds) was her speed equal to 2 m/s? Solution: We are looking for the derivative x(t) (of the path function in time). In task 1.1 we substitute its value instead of t and calculate the speed (Answer: 59). In Problem 1.2, we equate the found derivative to a given number and solve the equation with respect to the variable t. (Answer: 7). Geometric Applications 2.1 The line 𝑦 = 7𝑥 − 5 is parallel to the tangent to the graph 2 of the function 𝑦 = 𝑥 + 6𝑥 − 8 . Find the abscissa of the point of contact. 2.2 The line 𝑦 = 3𝑥 + 1 is tangent to the 2nd graph of the function 𝑎𝑥 + 2𝑥 + 3 . Find a. 2.3 The line 𝑦 = −5𝑥 + 8 is tangent to the 2nd graph of the function 28𝑥 + 𝑏𝑥 + 15 . Find b, given that the abscissa of the tangent point is greater than 0. 2.4 The line 𝑦 = 3𝑥 + 4 is tangent to graph 2 of the function 3𝑥 − 3𝑥 + 𝑐. Find c. Solution: In problem 2.1, we are looking for the derivative of the function and equate it to the slope of the straight line (Answer: 0.5). In problems 2.2-2.4 we make up a system of two equations. In one we equate functions, in the other we equate their derivatives. In a system with two unknowns (variable x and a parameter), we are looking for a parameter. (Answers: 2.2) a=0.125; 2.3) b=-33; 2.4) c=7). 2.5 The figure shows the graph of the function y=f(x) and the tangent to it at the point with the abscissa 𝑥0 . Find the value of the derivative of the function f(x) at the point 𝑥0 . 2.6 The figure shows the graph of the function y=f(x) and the tangent to it at the point with the abscissa 𝑥0 . Find the value of the derivative of the function f(x) at the point 𝑥0 . 2.7 The figure shows the graph of the function y=f(x). The straight line passing through the origin touches the graph of this function at the point with the abscissa 10. Find the value of the derivative of the function at the point x=10. 𝑥0 = 0 Solution: The value of the derivative of a function at a point is the tangent of the slope of the tangent to the graph of the function drawn at the given point. "Finishing" right triangle and look for the tangent of the corresponding angle, which we take as positive if the tangent forms an acute angle with the positive direction of the Ox axis (the tangent "increases") and negative if the angle is obtuse (the tangent decreases). In Problem 2.7, it is necessary to draw a tangent through the specified point and the origin. Answers: 2.5) 0.25; 2.6) -0.25; 2.7) -0.6. Reading a graph of a function or a graph of a derivative of a function 3.1 The figure shows a graph of the function y=f(x), defined on the interval (6;8). Determine the number of integer points where the derivative of the function is positive. 3.2 The figure shows a graph of the function y=f(x), defined on the interval (-5;5). Determine the number of integer points where the derivative of the function f(x) is negative. Solution: The sign of the derivative is related to the behavior of the function. If the derivative is positive, then select the part of the graph of the function where the function increases. If the derivative is negative, then where the function decreases. We select the interval corresponding to this part on the Ox axis. In accordance with the question of the task, we either recalculate the number of integers included in the given interval or find their sum. Answers: 3.1) 4; 3.2) 8. 3.3 The figure shows a graph of the function y=f(x), defined on the interval (-2;12). Find the sum of the extremum points of the function f(x). First of all, we look at what is in the figure: a graph of a function or a graph of a derivative. If this is a graph of a derivative, then we are only interested in the signs of the derivative and the abscissas of the points of intersection with the Ox axis. For clarity, you can draw a more familiar figure with the signs of the derivative with respect to the obtained intervals and the behavior of the function. According to the picture, answer the question of the task. (Answer: 3.3) 44). 3.4 The figure shows a graph of ′ y=𝑓 (𝑥) - the derivative of the function f(x), defined on the interval (-7;14]. Find the number of maximum points of the function f(x) belonging to the interval [-6;9] 3.5 The figure shows a graph of y=𝑓 ′ (𝑥) - the derivative of the function f(x), defined on the interval (-11;11)... Find the number of extremum points of the function f(x) belonging to the segment [-10;10] Solution: We are looking for the points of intersection of the graph of the derivative with the Ox axis, highlighting that part of the axis that is indicated in the problem. Determine the sign of the derivative at each of the obtained intervals (if the graph of the derivative is below the axis, then “-”, if above, then “+” The maximum points will be those where the sign has changed from “+” to “-”, the minimum points will be those where the sign has changed from “-” to “+”. The extremum points are both. Answers: 3.4) 1; 3.5) 5. 3.6 The figure shows the graph y=𝑓 ′ (𝑥) - the derivative of the function f(x), defined on the interval (-8;3). At what point of the segment [-3; 2] the function f(x) takes the maximum value. 3.7 The figure shows a graph of ′ y=𝑓 (𝑥) - the derivative of the function f(x), defined on the interval (-8;4). At what point of the segment [-7;-3] the function f(x) takes the smallest value. Solution: If the derivative changes sign on the segment under consideration, then the solution is based on the theorem: if a function continuous on the segment has a single extremum point on it and this is the maximum (minimum) point, then the largest (smallest) value of the function on this segment is reached in given point. If a function continuous on an interval is monotonic, then it reaches its minimum and highest values on this segment at its ends. Answers: 3.6) -3; 3.7)-7. 3.8 The figure shows a graph of the function y=f(x), defined on the interval (-5;5). Find the number of points where the tangent to the graph of the function is parallel to the line y=6 or coincides with it. 3.9 The figure shows a graph of the function y=f(x) and eight points on the x-axis: 𝑥1 ,𝑥2 ,𝑥3 , … , 𝑥12 . At how many of these points is the derivative of the function f(x) positive? 4.2 The figure shows a graph of y=𝑓 ′ (𝑥) - the derivative of the function f(x), defined on the interval (-5;7). Find the intervals of decreasing function f(x). In your answer, indicate the sum of integer points included in these intervals. 4.5 The figure shows the graph y=𝑓 ′ (𝑥) - the derivative of the function f(x), defined on the interval (-4;8). Find the extremum point of the function f(x) belonging to the segment [-2;6]. 4.6 The figure shows the graph y=𝑓 ′ (𝑥) - the derivative of the function f(x), defined on the interval (-10;2). Find the number of points where the tangent to the graph of the function f(x) is parallel to or coincides with the line y=-2x-11. Solution: 4.6 Since the graph of the derivative is shown in the figure, and the tangent is parallel to this line, the derivative of the function at this point is -2. We are looking for points on the graph of the derivative with an ordinate equal to -2 and count their number. We get 5. Answers: 3.8) 4; 3.9) 5; 4.2) 18; 4.5) 4; 4.6) 5. 4.8 The figure shows the graph y=𝑓 ′ (𝑥) - the derivative of the function f(x). Find the abscissa of the point where the tangent to the graph y=f(x) is parallel to or coincides with the x-axis. Solution: If the line is parallel to the Ox axis, then its slope is zero. The slope of the tangent is zero, so the derivative is zero. We are looking for the abscissa of the point of intersection of the graph of the derivative with the axis Ox. We get -3. 4.9 The figure shows the graph of the function y=𝑓 ′ (x) the derivative of the function f(x) and eight points on the x-axis: 𝑥1 ,𝑥2 ,𝑥3 , … , 𝑥8 . At how many of these points does the derivative of the function f(x) increase? Geometric meaning of a definite integral 5.1 The figure shows a graph of some function y=f(x) (two rays with a common starting point). Using the figure, compute F(8)-F(2), where F(x) is one of the antiderivatives of f(x). Solution: The area of a curvilinear trapezoid is calculated through a definite integral. The definite integral is calculated by the Newton-Leibniz formula as an increment of the antiderivative. In problem 5.1, we calculate the area of the trapezoid according to the well-known geometry course formula (this will be the increment of the antiderivative). In tasks 5. 2 and 5.3 the antiderivative is already given. It is necessary to calculate its values at the ends of the segment and calculate the difference. 5.2 The figure shows a graph of some function y=f(x). The function 𝐹 𝑥 = 15 3 2 𝑥 + 30𝑥 + 302𝑥 − is one of the 8 antiderivatives of the function f(x). Find the area of the shaded figure. Solution: The area of a curvilinear trapezoid is calculated through a definite integral. The definite integral is calculated by the Newton-Leibniz formula as an increment of the antiderivative. In problem 5.1, we calculate the area of the trapezoid according to the well-known geometry course formula (this will be the increment of the antiderivative). In Problem 5.2, an antiderivative is already given. It is necessary to calculate its values at the ends of the segment and calculate the difference. Good luck on the exam in mathematics