\(\blacktriangleright\) To find the largest/ smallest value function on the segment \(\) , it is necessary to schematically depict the graph of the function on this segment.
In the problems from this subtopic, this can be done using the derivative: find the intervals of increase (\(f">0\) ) and decrease (\(f"<0\)
) функции, критические точки (где \(f"=0\)
или \(f"\)
не существует).
\(\blacktriangleright\) Do not forget that the function can take the maximum/smallest value not only at the internal points of the segment \(\) , but also at its ends.
\(\blacktriangleright\) The largest/smallest value of the function is the value of the coordinate \(y=f(x)\) .
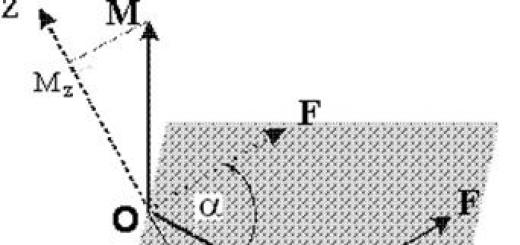
\(\blacktriangleright\) The derivative of a complex function \(f(t(x))\) is searched according to the rule: \[(\Large(f"(x)=f"(t)\cdot t"(x)))\]
\[\begin(array)(|r|c|c|) \hline & \text(Function ) f(x) & \text(Derivative ) f"(x)\\ \hline \textbf(1) & c & 0\\&&\\ \textbf(2) & x^a & a\cdot x^(a-1)\\&&\\ \textbf(3) & \ln x & \dfrac1x\\&&\\ \ textbf(4) & \log_ax & \dfrac1(x\cdot \ln a)\\&&\\ \textbf(5) & e^x & e^x\\&&\\ \textbf(6) & a^x & a^x\cdot \ln a\\&&\\ \textbf(7) & \sin x & \cos x\\&&\\ \textbf(8) & \cos x & -\sin x\\ \hline \end(array) \quad \quad \quad \quad \begin(array)(|r|c|c|) \hline & \text(Function ) f(x) & \text(Derivative ) f"(x) \\ \hline \textbf(9) & \mathrm(tg)\, x & \dfrac1(\cos^2 x)\\&&\\ \textbf(10) & \mathrm(ctg)\, x & -\ ,\dfrac1(\sin^2 x)\\&&\\ \textbf(11) & \arcsin x & \dfrac1(\sqrt(1-x^2))\\&&\\ \textbf(12) & \ arccos x & -\,\dfrac1(\sqrt(1-x^2))\\&&\\ \textbf(13) & \mathrm(arctg)\, x & \dfrac1(1+x^2)\\ &&\\ \textbf(14) & \mathrm(arcctg)\, x & -\,\dfrac1(1+x^2)\\ \hline \end(array)\]
Task 1 #2357
Task level: Equal to the Unified State Examination
Find the smallest value of the function \(y = e^(x^2 - 4)\) on the interval \([-10; -2]\) .
ODZ: \(x\) - arbitrary.
1) \
\ So \(y" = 0\) when \(x = 0\) .
3) Let's find intervals of constant sign \(y"\) on the considered segment \([-10; -2]\) :

4) Sketch of the graph on the segment \([-10; -2]\) :

Thus, the function reaches its smallest value on \([-10; -2]\) at \(x = -2\) .
\ Total: \(1\) is the smallest value of the function \(y\) on \([-10; -2]\) .
Answer: 1
Task 2 #2355
Task level: Equal to the Unified State Examination
\(y = \sqrt(2)\cdot\sqrt(x^2 + 1)\) on the segment \([-1; 1]\) .
ODZ: \(x\) - arbitrary.
1) \
Let's find the critical points (that is, the internal points of the domain of the function, in which its derivative is equal to \(0\) or does not exist): \[\sqrt(2)\cdot\dfrac(x)(\sqrt(x^2 + 1)) = 0\qquad\Leftrightarrow\qquad x = 0\,.\] The derivative exists for any \(x\) .
2) Find the intervals of constant sign \(y"\) :

3) Let's find intervals of constant sign \(y"\) on the considered segment \([-1; 1]\) :

4) Sketch of the graph on the segment \([-1; 1]\) :

Thus, the function reaches its maximum value on \([-1; 1]\) in \(x = -1\) or in \(x = 1\) . Let's compare the values of the function at these points.
\ Total: \(2\) is the largest value of the function \(y\) on \([-1; 1]\) .
Answer: 2
Task 3 #2356
Task level: Equal to the Unified State Examination
Find the smallest value of the function \(y = \cos 2x\) on the interval \(\) .
ODZ: \(x\) - arbitrary.
1) \
Let's find the critical points (that is, the internal points of the domain of the function, in which its derivative is equal to \(0\) or does not exist): \[-2\cdot \sin 2x = 0\qquad\Leftrightarrow\qquad 2x = \pi n, n\in\mathbb(Z)\qquad\Leftrightarrow\qquad x = \dfrac(\pi n)(2), n\in\mathbb(Z)\,.\] The derivative exists for any \(x\) .
2) Find the intervals of constant sign \(y"\) :

(here there is an infinite number of intervals in which the signs of the derivative alternate).
3) Let's find intervals of constancy \(y"\) on the considered segment \(\) :

4) Sketch of the graph on the segment \(\) :

Thus, the function reaches its smallest value on \(\) at \(x = \dfrac(\pi)(2)\) .
\ Total: \(-1\) is the smallest value of the function \(y\) on \(\) .
Answer: -1
Task 4 #915
Task level: Equal to the Unified State Examination
Find the largest value of a function
\(y = -\log_(17)(2x^2 - 2\sqrt(2)x + 2)\).
ODZ: \(2x^2 - 2\sqrt(2)x + 2 > 0\) . Let's decide on ODZ:
1) Denote \(2x^2-2\sqrt(2)x+2=t(x)\) , then \(y(t)=-\log_(17)t\) .
Let's find the critical points (that is, the internal points of the domain of the function, in which its derivative is equal to \(0\) or does not exist): \[-\dfrac(1)(\ln 17)\cdot\dfrac(4x-2\sqrt(2))(2x^2-2\sqrt(2)x+2) = 0\qquad\Leftrightarrow\qquad 4x-2\sqrt(2) = 0\]– on the ODZ, from where we find the root \(x = \dfrac(\sqrt(2))(2)\) . The derivative of the function \(y\) does not exist for \(2x^2-2\sqrt(2)x+2 = 0\) , but given equation negative discriminant, hence it has no solutions. In order to find the largest / smallest value of a function, you need to understand how its graph looks schematically.
2) Find the intervals of constant sign \(y"\) :

3) Graphic sketch:

Thus, the function reaches its maximum value at \(x = \dfrac(\sqrt(2))(2)\) :
\(y\left(\dfrac(\sqrt(2))(2)\right) = -\log_(17)1 = 0\),
Total: \(0\) is the largest value of the function \(y\) .
Answer: 0
Task 5 #2344
Task level: Equal to the Unified State Examination
Find the smallest value of a function
\(y = \log_(3)(x^2 + 8x + 19)\).
ODZ: \(x^2 + 8x + 19 > 0\) . Let's decide on ODZ:
1) Denote \(x^2 + 8x + 19=t(x)\) , then \(y(t)=\log_(3)t\) .
Let's find the critical points (that is, the internal points of the domain of the function, in which its derivative is equal to \(0\) or does not exist): \[\dfrac(1)(\ln 3)\cdot\dfrac(2x+8)(x^2 + 8x + 19) = 0\qquad\Leftrightarrow\qquad 2x+8 = 0\]- on the ODZ, from where we find the root \ (x \u003d -4 \) . The derivative of the function \(y\) does not exist for \(x^2 + 8x + 19 = 0\) , but this equation has a negative discriminant, therefore, it has no solutions. In order to find the largest / smallest value of a function, you need to understand how its graph looks schematically.
2) Find the intervals of constant sign \(y"\) :

3) Graphic sketch:

Thus, \(x = -4\) is the minimum point of the function \(y\) and the smallest value is reached in it:
\(y(-4) = \log_(3)3 = 1\) .
Total: \(1\) is the smallest value of the function \(y\) .
Answer: 1
Task 6 #917
Task level: More difficult than the exam
Find the largest value of a function
\(y = -e^((x^2 - 12x + 36 + 2\ln 2))\).
From a practical point of view, the most interesting is the use of the derivative to find the largest and smallest value of a function. What is it connected with? Maximizing profits, minimizing costs, determining the optimal load of equipment... In other words, in many areas of life, one has to solve the problem of optimizing some parameters. And this is the problem of finding the largest and smallest values of the function.
It should be noted that the largest and smallest value of a function is usually sought on some interval X , which is either the entire domain of the function or part of the domain. The interval X itself can be a line segment, an open interval ![]() , an infinite interval .
, an infinite interval .
In this article, we will talk about finding the largest and smallest values explicitly. given function one variable y=f(x) .
Page navigation.
The largest and smallest value of a function - definitions, illustrations.
Let us briefly dwell on the main definitions.
The largest value of the function ![]() , which for any
, which for any ![]() the inequality is true.
the inequality is true.
The smallest value of the function y=f(x) on the interval X is called such a value ![]() , which for any
, which for any ![]() the inequality is true.
the inequality is true.
These definitions are intuitive: the largest (smallest) value of a function is the largest (smallest) value accepted on the interval under consideration with the abscissa.
Stationary points are the values of the argument at which the derivative of the function vanishes.
Why do we need stationary points when finding the largest and smallest values? The answer to this question is given by Fermat's theorem. It follows from this theorem that if a differentiable function has an extremum (local minimum or local maximum) at some point, then this point is stationary. Thus, the function often takes its maximum (smallest) value on the interval X at one of the stationary points from this interval.
Also, a function can often take on the largest and smallest values at points where the first derivative of this function does not exist, and the function itself is defined.
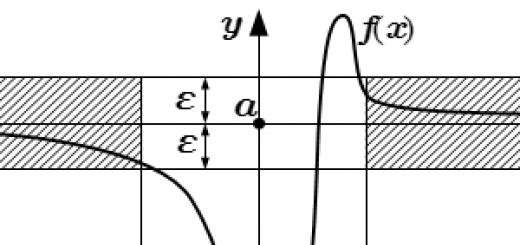
Let's immediately answer one of the most common questions on this topic: "Is it always possible to determine the largest (smallest) value of a function"? No not always. Sometimes the boundaries of the interval X coincide with the boundaries of the domain of the function, or the interval X is infinite. And some functions at infinity and on the boundaries of the domain of definition can take both infinitely large and infinitely small values. In these cases, nothing can be said about the largest and smallest value of the function.
For clarity, we give a graphic illustration. Look at the pictures - and much will become clear.
On the segment

In the first figure, the function takes the largest (max y ) and smallest (min y ) values at stationary points inside the segment [-6;6] .
Consider the case shown in the second figure. Change the segment to . In this example, the smallest value of the function is achieved at a stationary point, and the largest - at a point with an abscissa corresponding to the right boundary of the interval.
In figure No. 3, the boundary points of the segment [-3; 2] are the abscissas of the points corresponding to the largest and smallest value of the function.
In the open range

In the fourth figure, the function takes the largest (max y ) and smallest (min y ) values at stationary points within the open interval (-6;6) .
On the interval , no conclusions can be drawn about the largest value.
At infinity

In the example shown in the seventh figure, the function takes the largest value (max y ) at a stationary point with the abscissa x=1 , and the smallest value (min y ) is reached at the right boundary of the interval. At minus infinity, the values of the function asymptotically approach y=3 .
On the interval, the function does not reach either the smallest or the largest value. As x=2 tends to the right, the function values tend to minus infinity (the straight line x=2 is a vertical asymptote), and as the abscissa tends to plus infinity, the function values asymptotically approach y=3 . A graphic illustration of this example is shown in Figure 8.
Algorithm for finding the largest and smallest values of a continuous function on the segment .
We write an algorithm that allows us to find the largest and smallest value of a function on a segment.
- We find the domain of the function and check if it contains the entire segment .
- We find all points at which the first derivative does not exist and which are contained in the segment (usually such points occur in functions with an argument under the module sign and in power functions with a fractional rational exponent). If there are no such points, then go to the next point.
- We determine all stationary points that fall into the segment. To do this, we equate it to zero, solve the resulting equation and choose the appropriate roots. If there are no stationary points or none of them fall into the segment, then go to the next step.
- We calculate the values of the function at the selected stationary points (if any), at points where the first derivative does not exist (if any), and also at x=a and x=b .
- From the obtained values of the function, we select the largest and smallest - they will be the desired maximum and smallest values of the function, respectively.
Let's analyze the algorithm when solving an example for finding the largest and smallest values of a function on a segment.
Example.
Find the largest and smallest value of a function
- on the segment;
- on the interval [-4;-1] .
Decision.
The domain of the function is the entire set of real numbers, except for zero, that is, . Both segments fall within the domain of definition.
We find the derivative of the function with respect to: 
Obviously, the derivative of the function exists at all points of the segments and [-4;-1] .
Stationary points are determined from the equation . the only real root is x=2 . This stationary point falls into the first segment.
For the first case, we calculate the values of the function at the ends of the segment and at a stationary point, that is, for x=1 , x=2 and x=4 : 
Therefore, the largest value of the function ![]() is reached at x=1 , and the smallest value
is reached at x=1 , and the smallest value  – at x=2 .
For the second case, we calculate the values of the function only at the ends of the segment [-4;-1] (since it does not contain a single stationary point): 
Decision.
Let's start with the scope of the function. Square trinomial the denominator of a fraction must not vanish: 
It is easy to check that all intervals from the condition of the problem belong to the domain of the function.
Let's differentiate the function: 
Obviously, the derivative exists on the entire domain of the function.
Let's find stationary points. The derivative vanishes at . This stationary point falls within the intervals (-3;1] and (-3;2) .
And now you can compare the results obtained at each point with the graph of the function. The blue dotted lines indicate the asymptotes.

This can end with finding the largest and smallest value of the function. The algorithms discussed in this article allow you to get results with a minimum of actions. However, it can be useful to first determine the intervals of increase and decrease of the function and only after that draw conclusions about the largest and smallest value of the function on any interval. This gives a clearer picture and a rigorous justification of the results.
Option 1. at
1. Graph of a function y=f(x) shown in the figure.
Specify the largest value of this function 1
on the segment [ a; b]. a 0 1 b x
1) 2,5; 2) 3; 3) 4; 4) 2.
https://pandia.ru/text/78/524/images/image003_127.gif" width="242" height="133 src="> 1) -4; 2) -2; 3) 4; 4) 2.
4. Functions y=f(x) set on the segment [ a; b]. at
The figure shows a graph of its derivative
y=f ´(x). Explore for extremes 1 b
function y=f(x). Please indicate the quantity in your answer. a 0 1 x
minimum points.
1) 6; 2) 7; 3) 4;
5. Find the largest value of a function y \u003d -2x2 + 8x -7.
1) -2; 2) 7; 3) 1;
6. Find the smallest value of a function ![]() on the segment .
on the segment .
1) https://pandia.ru/text/78/524/images/image005_87.gif" width="17" height="48 src=">.
7. Find the smallest value of a function y=|2x+3| - .
1) - https://pandia.ru/text/78/524/images/image006_79.gif" width="17" height="47"> ; 4) - .
https://pandia.ru/text/78/524/images/image009_67.gif" width="144" height="33 src="> has a minimum at the point xo=1.5?
1) 5; 2) -6; 3) 4; 4) 6.at
9. Specify the largest value of the function y=f(x) ,
1 x
0 1
1) 2,5; 2) 3; 3) -3;
y=lg(100 – x2 ).
1) 10 ; 2) 100 ; 3) 2 ; 4) 1 .
11. Find the smallest value of a function y=2sin-1.
1) -1 ; 2) -3 ; 3) -2 ; 4) - .
Test 14 The largest (smallest) value of the function.
https://pandia.ru/text/78/524/images/image013_44.gif" width="130" height="115 src=">1. Graph of the function y=f(x) shown in the figure.
Specify the smallest value of this function 1
on the segment [ a; b]. a b
0 1 x
1) 0; 2) - 4 ,5; 3) -2; 4) - 3.
 |
2. at The figure shows a graph of the function y=f(x).
How many maximum points does the function have?
1
0 1 x 1) 5; 2) 6; 3) 4; 4) 1.
3. At what point is the function y \u003d 2x2 + 24x -25 takes on the smallest value?
https://pandia.ru/text/78/524/images/image018_37.gif" width="76" height="48"> on the segment [-3;-1].
1) - https://pandia.ru/text/78/524/images/image020_37.gif" width="17" height="47 src=">; 2); 4) - 5.
https://pandia.ru/text/78/524/images/image022_35.gif" width="135" height="33 src="> has a minimum at the point xo = -2?
; 2) -6;; 4) 6.at
9. Specify the smallest value of the function y=f(x) ,
whose graph is shown in the figure. 1 x
0 1
1) -1,5; 2) -1; 3) -3;
10. Find the largest value of a function y=log11 (121 – x2 ).
1) 11;; 3) 1;
11. Find the largest value of a function y=2cos+3.
1) 5 ; 2) 3 ; 3) 2 ; 4) .
Answers :
In this article I will talk about algorithm for finding the largest and smallest value function, minimum and maximum points.
From theory, we will definitely need derivative table and differentiation rules. It's all in this board:
Algorithm for finding the largest and smallest values.
I find it easier to explain with a concrete example. Consider:
Example: Find the largest value of the function y=x^5+20x^3–65x on the segment [–4;0].
Step 1. We take the derivative.
Y" = (x^5+20x^3–65x)" = 5x^4 + 20*3x^2 - 65 = 5x^4 + 60x^2 - 65
Step 2 Finding extremum points.
extremum point we name such points at which the function reaches its maximum or minimum value.
To find the extremum points, it is necessary to equate the derivative of the function to zero (y "= 0)
5x^4 + 60x^2 - 65 = 0
Now we solve this biquadratic equation and the found roots are our extremum points.
I solve such equations by replacing t = x^2, then 5t^2 + 60t - 65 = 0.
Reduce the equation by 5, we get: t^2 + 12t - 13 = 0
D = 12^2 - 4*1*(-13) = 196
T_(1) = (-12 + sqrt(196))/2 = (-12 + 14)/2 = 1
T_(2) = (-12 - sqrt(196))/2 = (-12 - 14)/2 = -13
We make the reverse substitution x^2 = t:
X_(1 and 2) = ±sqrt(1) = ±1
x_(3 and 4) = ±sqrt(-13) (we exclude, under the root cannot be negative numbers(unless, of course, we are talking about complex numbers)
Total: x_(1) = 1 and x_(2) = -1 - these are our extremum points.
Step 3 Determine the largest and smallest value.
Substitution method.
In the condition, we were given the segment [b][–4;0]. The point x=1 is not included in this segment. So we don't consider it. But in addition to the point x=-1, we also need to consider the left and right borders of our segment, that is, the points -4 and 0. To do this, we substitute all these three points into the original function. Notice the original one is the one given in the condition (y=x^5+20x^3–65x), some start substituting into the derivative...
Y(-1) = (-1)^5 + 20*(-1)^3 - 65*(-1) = -1 - 20 + 65 = [b]44
y(0) = (0)^5 + 20*(0)^3 - 65*(0) = 0
y(-4) = (-4)^5 + 20*(-4)^3 - 65*(-4) = -1024 - 1280 + 260 = -2044
This means that the maximum value of the function is [b]44 and it is reached at the points [b]-1, which is called the maximum point of the function on the segment [-4; 0].
We decided and got an answer, we are great, you can relax. But stop! Don't you think that counting y(-4) is somehow too complicated? In conditions of limited time, it is better to use another method, I call it like this:
Through intervals of constancy.
These gaps are found for the derivative of the function, that is, for our biquadratic equation.
I do it in the following way. I draw a directional line. I set the points: -4, -1, 0, 1. Despite the fact that 1 is not included in the given segment, it should still be noted in order to correctly determine the intervals of constancy. Let's take some number many times greater than 1, let's say 100, mentally substitute it into our biquadratic equation 5(100)^4 + 60(100)^2 - 65. Even without counting anything, it becomes obvious that at the point 100 the function has plus sign. This means that for intervals from 1 to 100 it has a plus sign. When passing through 1 (we go from right to left), the function will change sign to minus. When passing through the point 0, the function will retain its sign, since this is only the boundary of the segment, and not the root of the equation. When passing through -1, the function will again change sign to plus.

From theory, we know that where the derivative of the function is (and we drew this for it) changes sign from plus to minus (point -1 in our case) function reaches its local maximum (y(-1)=44 as calculated earlier) on this segment (this is logically very clear, the function has ceased to increase, since it reached its maximum and began to decrease).
Accordingly, where the derivative of the function changes sign from minus to plus, achieved local minimum of a function. Yes, yes, we also found the local minimum point, which is 1, and y(1) is the minimum value of the function on the interval, let's say from -1 to +∞. Please note that this is only a LOCAL MINIMUM, that is, a minimum on a certain segment. Since the actual (global) minimum function will reach somewhere there, in -∞.
In my opinion, the first method is simpler theoretically, and the second one is simpler in terms of arithmetic operations, but much more difficult in terms of theory. After all, sometimes there are cases when the function does not change sign when passing through the root of the equation, and indeed you can get confused with these local, global maxima and minima, although you will have to master this well anyway if you plan to enter technical university(and why otherwise take the profile exam and solve this task). But practice and only practice will teach you how to solve such problems once and for all. And you can train on our website. Here .
If you have any questions, or something is not clear, be sure to ask. I will be happy to answer you, and make changes, additions to the article. Remember we are making this site together!
Let's see how to explore a function using a graph. It turns out that looking at the graph, you can find out everything that interests us, namely:
- function scope
- function range
- function zeros
- periods of increase and decrease
- high and low points
- the largest and smallest value of the function on the interval.

Let's clarify the terminology:
Abscissa is the horizontal coordinate of the point.
Ordinate- vertical coordinate.
abscissa- the horizontal axis, most often called the axis.
Y-axis- vertical axis, or axis.
Argument is an independent variable on which the values of the function depend. Most often indicated.
In other words, we ourselves choose , substitute in the function formula and get .
Domain functions - the set of those (and only those) values of the argument for which the function exists.
Denoted: or .
In our figure, the domain of the function is a segment. It is on this segment that the graph of the function is drawn. Only here this function exists.
Function range is the set of values that the variable takes. In our figure, this is a segment - from the lowest to the highest value.
Function zeros- points where the value of the function is equal to zero, i.e. . In our figure, these are the points and .
Function values are positive where . In our figure, these are the intervals and .
Function values are negative where . We have this interval (or interval) from to.
The most important concepts - increasing and decreasing function on some set. As a set, you can take a segment, an interval, a union of intervals, or the entire number line.
Function increases
In other words, the more , the more , that is, the graph goes to the right and up.
Function decreasing on the set if for any and belonging to the set the inequality implies the inequality .
For a decreasing function, a larger value corresponds to a smaller value. The graph goes right and down.
In our figure, the function increases on the interval and decreases on the intervals and .
Let's define what is maximum and minimum points of the function.
Maximum point- this is an internal point of the domain of definition, such that the value of the function in it is greater than in all points sufficiently close to it.
In other words, the maximum point is such a point, the value of the function at which more than in neighboring ones. This is a local "hill" on the chart.
In our figure - the maximum point.
Low point- an internal point of the domain of definition, such that the value of the function in it is less than in all points sufficiently close to it.
That is, the minimum point is such that the value of the function in it is less than in neighboring ones. On the graph, this is a local “hole”.
In our figure - the minimum point.
The point is the boundary. It is not an interior point of the domain of definition and therefore does not fit the definition of a maximum point. After all, she has no neighbors on the left. In the same way, there can be no minimum point on our chart.
The maximum and minimum points are collectively called extremum points of the function. In our case, this is and .
But what if you need to find, for example, function minimum on the cut? In this case, the answer is: because function minimum is its value at the minimum point.
Similarly, the maximum of our function is . It is reached at the point .
We can say that the extrema of the function are equal to and .
Sometimes in tasks you need to find the largest and smallest values of the function on a given segment. They do not necessarily coincide with extremes.
In our case smallest function value on the interval is equal to and coincides with the minimum of the function. But its largest value on this segment is equal to . It is reached at the left end of the segment.
In any case, the largest and smallest values of a continuous function on a segment are achieved either at the extremum points or at the ends of the segment.