The same substance real world may be in different states depending on the environment. For example, water can be in the form of a liquid, in the idea of a solid body - ice, in the form of a gas - water vapor.
- These states are called aggregate states of matter.
Molecules of a substance in different states of aggregation do not differ from each other. Specific state of aggregation is determined by the arrangement of molecules, as well as the nature of their movement and interaction with each other.
Gas - the distance between molecules is much larger than the size of the molecules themselves. Molecules in a liquid and in a solid are quite close to each other. AT solids even closer.
To change the aggregate body condition, he needs to give some energy. For example, in order to convert water into steam, it must be heated. In order for steam to become water again, it must give up energy.
The transition from solid to liquid
The transition of a substance from a solid to a liquid state is called melting. In order for the body to begin to melt, it must be heated to a certain temperature. The temperature at which a substance melts is called the melting point of the substance.
Each substance has its own melting point. For some bodies it is very low, for example, for ice. And some bodies have a very high melting point, for example, iron. In general, the melting of a crystalline body is a complex process.
ice melt chart
The figure below shows a graph of the melting of a crystalline body, in this case ice.
- The graph shows the dependence of the temperature of the ice on the time that it is heated. Temperature is plotted on the vertical axis, time is plotted on the horizontal axis.
From the graph, the initial temperature of the ice was -20 degrees. Then they started to heat it up. The temperature started to rise. Section AB is the section of ice heating. Over time, the temperature increased to 0 degrees. This temperature is considered the melting point of ice. At this temperature, the ice began to melt, but at the same time its temperature ceased to increase, although the ice also continued to heat up. The melting area corresponds to the BC section on the graph.
Then, when all the ice melted and turned into a liquid, the temperature of the water began to increase again. This is shown on the graph by ray C. That is, we conclude that during melting, the body temperature does not change, All incoming energy is used for heating.
(the amount of heat transferred to the liquid when heated)
1. The system of actions for obtaining and processing the results of measuring the time of heating the liquid to a certain temperature and changing the temperature of the liquid:
1) check if an amendment needs to be introduced; if so, introduce an amendment;
2) determine how many measurements of a given quantity need to be made;
3) prepare a table for recording and processing the results of observations;
4) to make the specified number of measurements of a given quantity; record the results of observations in a table;
5) find the measured value of the quantity as the arithmetic mean of the results of individual observations, taking into account the reserve figure rule:
6) calculate the modules of absolute deviations of the results of individual measurements from the average:
7) find random error;
8) find the instrumental error;
9) find the reading error;
10) find the calculation error;
11) find the total absolute error;
12) record the result indicating the total absolute error.
2. The system of actions for plotting the dependency graph Δ t = f(Δ τ ):
1) draw coordinate axes; denote the abscissa axis Δ τ , with, and the y-axis is Δ t, 0 С;
2) select the scales for each of the axes and apply scales on the axes;
3) depict the intervals of values Δ τ and Δ t for every experience;
4) draw a smooth line so that it runs inside the intervals.
3. OI No. 1 - water weighing 100 g at an initial temperature of 18 0 С:
1) to measure the temperature, we will use a thermometer with a scale of up to 100 0 C; to measure the heating time, we will use a sixty-second mechanical stopwatch. These instruments do not require any adjustments;
2) when measuring the heating time to a fixed temperature, random errors are possible. Therefore, we will carry out 5 measurements of time intervals when heated to the same temperature (in the calculations, this will triple the random error). When measuring the temperature, no random errors were found. Therefore, we will assume that the absolute error in determining t, 0 C is equal to the instrumental error of the thermometer used, that is, the scale division value 2 0 C (Table 3);
3) make a table for recording and processing the measurement results:
| experience number | |||||||
| Δt, 0 C | 18±2 | 25±2 | 40±2 | 55±2 | 70±2 | 85±2 | 100±2 |
| τ 1 , s | 29,0 | 80,0 | 145,0 | 210,0 | 270,0 | 325,0 | |
| t2, s | 25,0 | 90,0 | 147,0 | 205,0 | 265,0 | 327,0 | |
| t 3 s | 30,0 | 85,0 | 150,0 | 210,0 | 269,0 | 330,0 | |
| t4, s | 27,0 | 89,0 | 143,0 | 202,0 | 272,0 | 330,0 | |
| t5, s | 26,0 | 87,0 | 149,0 | 207,0 | 269,0 | 329,0 | |
| tav, s | 27,4 | 86,2 | 146,8 | 206,8 | 269,0 | 328,2 |
4) the results of the measurements carried out are entered in the table;
5) arithmetic mean of each measurement τ calculated and indicated in the last line of the table;
for temperature 25 0 C:
7) find a random measurement error:
8) the instrumental error of the stopwatch in each case is found taking into account the full circles made by the second hand (that is, if one full circle gives an error of 1.5 s, then half a circle gives 0.75 s, and 2.3 circles - 3.45 s) . In the first experiment Δ t and= 0.7 s;
9) the error of reading a mechanical stopwatch is taken equal to one division of the scale: Δ t about= 1.0 s;
10) the calculation error in this case is zero;
11) calculate the total absolute error:
Δ t = Δ t C + Δ t and + Δ t0 + Δ t B= 4.44 + 0.7 + 1.0 + 0 = 6.14 s ≈ 6.1 s;
(here the final result is rounded down to one significant digit);
12) write down the measurement result: t= (27.4 ± 6.1) s
6 a) we calculate the modules of absolute deviations of the results of individual observations from the mean for temperature 40 0 С:
Δ t and= 2.0 s;
t about= 1.0 s;
Δ t = Δ t C + Δ t and + Δ t0 + Δ t B= 8.88 + 2.0 + 1.0 + 0 = 11.88 s ≈ 11.9 s;
t= (86.2 ± 11.9) s
for temperature 55 0 С:
Δ t and= 3.5 s;
t about= 1.0 s;
Δ t = Δ t C + Δ t and + Δ t0 + Δ t B= 6.72 + 3.5 + 1.0 + 0 = 11.22 s ≈ 11.2 s;
t= (146.8 ± 11.2) s
for temperature 70 0 C:
Δ t and= 5.0 s;
t about= 1.0 s;
Δ t= Δ t C + Δ t and + Δ t0 + Δ t B= 7.92 + 5.0 + 1.0 + 0 = 13.92 s ≈ 13.9 s;
12 c) write down the measurement result: t= (206.8 ± 13.9) s
for temperature 85 0 С:
Δ t and= 6.4 s;
9 d) mechanical stopwatch reading error Δt о = 1.0 s;
Δt = Δt C + Δt and + Δt 0 + Δt B = 4.8 + 6.4 + 1.0 + 0 = 12.2 s;
t= (269.0 ± 12.2) s
for temperature 100 0 C:
Δ t and= 8.0 s;
t about= 1.0 s;
10 e) the calculation error in this case is zero;
Δ t = Δ t C + Δ t and + Δ t0 + Δ t B= 5.28 + 8.0 + 1.0 + 0 = 14.28 s ≈ 14.3 s;
t= (328.2 ± 14.3) s.
The results of the calculations are presented in the form of a table, which shows the differences in the final and initial temperatures in each experiment and the time of heating the water.
4. Let's build a graph of the dependence of the change in water temperature on the amount of heat (heating time) (Fig. 14). When plotting, in all cases, the interval of time measurement error is indicated. The line thickness corresponds to the temperature measurement error.

Rice. 14. Graph of the dependence of the change in water temperature on the time of its heating
5. We establish that the graph we received is similar to a straight line graph proportional dependence y=kx. Coefficient value k in this case, it is easy to determine from the graph. Therefore, we can finally write Δ t= 0.25Δ τ . From the constructed graph, we can conclude that the water temperature is directly proportional to the amount of heat.
6. Repeat all measurements for OI No. 2 - sunflower oil.
In the table, in the last row, the average results are given.
| t, 0C | 18±2 | 25±2 | 40±2 | 55±2 | 70±2 | 85±2 | 100±2 |
| t1, c | 10,0 | 38,0 | 60,0 | 88,0 | 110,0 | 136,0 | |
| t2, c | 11,0 | 36,0 | 63,0 | 89,0 | 115,0 | 134,0 | |
| t3, c | 10,0 | 37,0 | 62,0 | 85,0 | 112,0 | 140,0 | |
| t4, c | 9,0 | 38,0 | 63,0 | 87,0 | 112,0 | 140,0 | |
| t5, c | 12,0 | 35,0 | 60,0 | 87,0 | 114,0 | 139,0 | |
| t cf, c | 10,4 | 36,8 | 61,6 | 87,2 | 112,6 | 137,8 |
6) calculate the modules of absolute deviations of the results of individual observations from the average for temperature 25 0 С:
1) find a random measurement error:
2) the instrumental error of the stopwatch in each case is found in the same way as in the first series of experiments. In the first experiment Δ t and= 0.3 s;
3) the error of reading a mechanical stopwatch is taken equal to one division of the scale: Δ t about= 1.0 s;
4) the calculation error in this case is zero;
5) calculate the total absolute error:
Δ t = Δ t C + Δ t and + Δ t0 + Δ t B= 2.64 + 0.3 + 1.0 + 0 = 3.94 s ≈ 3.9 s;
6) write down the measurement result: t= (10.4 ± 3.9) s
6 a) We calculate the modules of absolute deviations of the results of individual observations from the mean for temperature 40 0 С:
7 a) we find a random measurement error:
8 a) instrumental error of the stopwatch in the second experiment
Δ t and= 0.8 s;
9 a) mechanical stopwatch reading error Δ t about= 1.0 s;
10 a) the calculation error in this case is zero;
11 a) we calculate the total absolute error:
Δ t = Δ t C + Δ t and + Δ t0 + Δ t B= 3.12 + 0.8 + 1.0 + 0 = 4.92 s ≈ 4.9 s;
12 a) write down the measurement result: t= (36.8 ± 4.9) s
6 b) we calculate the modules of absolute deviations of the results of individual observations from the mean for temperature 55 0 С:
7 b) we find a random measurement error:
8 b) instrumental error of the stopwatch in this experiment
Δ t and= 1.5 s;
9 b) mechanical stopwatch reading error Δ t about= 1.0 s;
10 b) the calculation error in this case is zero;
11 b) we calculate the total absolute error:
Δ t = Δ t C + Δ t and + Δ t0 + Δ t B= 3.84 + 1.5 + 1.0 + 0 = 6.34 s ≈ 6.3 s;
12 b) write down the measurement result: t= (61.6 ± 6.3) s
6 c) we calculate the modules of absolute deviations of the results of individual observations from the mean for temperature 70 0 C:
7 c) we find a random measurement error:
8 c) instrumental error of the stopwatch in this experiment
Δ t and= 2.1 s;
9 c) mechanical stopwatch reading error Δ t about= 1.0 s;
10 c) the calculation error in this case is zero;
11 c) we calculate the total absolute error:
Δ t = Δ t C + Δ t and + Δ t0 + Δ t B= 2.52 + 2.1 + 1.0 + 0 = 5.62 s ≈ 5.6 s;
12 c) write down the measurement result: t = (87.2 ± 5.6) s
6 d) calculate the modules of absolute deviations of the results of individual observations from the mean for temperature 85 0 С:
7 d) we find a random measurement error:
8 d) instrumental error of the stopwatch in this experiment
Δ t and= 2.7 s;
9 d) mechanical stopwatch reading error Δ t about= 1.0 s;
10 d) the calculation error in this case is zero;
11 d) we calculate the total absolute error:
Δ t = Δ t C + Δ t and + Δ t0 + Δ t B= 4.56 + 2.7 + 1.0 + 0 = 8.26 s ≈ 8.3;
12 d) write down the measurement result: t= (112.6 ± 8.3) s
6 e) calculate the modules of absolute deviations of the results of individual observations from the mean for temperature 100 0 C:
7 e) we find a random measurement error:
8 e) instrumental error of the stopwatch in this experiment
Δ t and= 3.4 s;
9 e) mechanical stopwatch reading error Δ t about= 1.0 s;
10 e) the calculation error in this case is zero.
11 e) we calculate the total absolute error:
Δ t = Δ t C + Δ t and + Δ t0 + Δ t B= 5.28 + 3.4 + 1.0 + 0 = 9.68 s ≈ 9.7 s;
12 e) write down the measurement result: t= (137.8 ± 9.7) s.
The results of the calculations are presented in the form of a table, which shows the differences in the final and initial temperatures in each experiment and the heating time of sunflower oil.
7. Let's build a graph of the dependence of the change in oil temperature on the heating time (Fig. 15). When plotting, in all cases, the interval of time measurement error is indicated. The line thickness corresponds to the temperature measurement error.

Rice. 15. Graph of the dependence of the change in water temperature on the time of its heating
8. The constructed graph is similar to a graph of a direct proportional relationship y=kx. Coefficient value k in this case, it is easy to find from the graph. Therefore, we can finally write Δ t= 0.6Δ τ .
From the constructed graph, we can conclude that the temperature of sunflower oil is directly proportional to the amount of heat.
9. We formulate the answer to the PZ: the temperature of the liquid is directly proportional to the amount of heat received by the body when heated.
Example 3. PZ: set the type of dependence of the output voltage on the resistor R n on the value of the equivalent resistance of the circuit section AB (the problem is solved on an experimental setup, the schematic diagram of which is shown in Fig. 16).
To solve this problem, you need to perform the following steps.
1. Draw up a system of actions for obtaining and processing the results of measuring the equivalent resistance of a circuit section and voltage at the load R n(See Section 2.2.8 or Section 2.2.9).
2. Draw up a system of actions for plotting the dependence of the output voltage (on a resistor R n) from the equivalent resistance of the circuit section AB.
3. Select ROI No. 1 - a section with a certain value R n1 and perform all the actions planned in paragraphs 1 and 2.
4. Choose a functional dependence known in mathematics, the graph of which is similar to the experimental curve.
5. Write down mathematically this functional dependence for the load R n1 and formulate for her the answer to the cognitive task.
6. Select ROI No. 2 - a segment of the aircraft with a different resistance value R H2 and perform the same system of actions with it.
7. Choose a functional dependence known in mathematics, the graph of which is similar to the experimental curve.
8. Write down mathematically this functional dependence for resistance R H2 and formulate for him the answer to the cognitive task.
9. Formulate a functional relationship between the quantities in a generalized form.
Report on the identification of the type of dependence of the output voltage on the resistance R n from the equivalent resistance of the circuit section AB
(provided in an abridged version)
The independent variable is the equivalent resistance of the circuit section AB, which is measured using a digital voltmeter connected to points A and B of the circuit. The measurements were carried out at the limit of 1000 ohms, that is, the measurement accuracy is equal to the price of the least significant digit, which corresponds to ±1 ohm.
The dependent variable was the value of the output voltage taken at the load resistance (points B and C). As measuring device a digital voltmeter with a minimum discharge of hundredths of a volt was used.

Rice. 16. Scheme of the experimental setup for studying the type of dependence of the output voltage on the value of the equivalent resistance of the circuit
The equivalent resistance was changed using keys Q 1 , Q 2 and Q 3 . For convenience, the switched on state of the key will be denoted by “1”, and the switched off state by “0”. In this chain, only 8 combinations are possible.
For each combination, the output voltage was measured 5 times.
The following results were obtained during the study:
| Experience number | Key Status | Equivalent resistance R E, Ohm | Output voltage, U out, AT | |||||
| U 1,AT | U 2, AT | U 3, AT | U 4, AT | U 5, AT | ||||
| Q 3 Q 2 Q 1 | ||||||||
| 0 0 0 | 0,00 | 0,00 | 0,00 | 0,00 | 0,00 | |||
| 0 0 1 | 800±1 | 1,36 | 1,35 | 1,37 | 1,37 | 1,36 | ||
| 0 1 0 | 400±1 | 2,66 | 2,67 | 2,65 | 2,67 | 2,68 | ||
| 0 1 1 | 267±1 | 4,00 | 4,03 | 4,03 | 4,01 | 4,03 | ||
| 1 0 0 | 200±1 | 5,35 | 5,37 | 5,36 | 5,33 | 5,34 | ||
| 1 0 1 | 160±1 | 6,70 | 6,72 | 6,73 | 6,70 | 6,72 | ||
| 1 1 0 | 133±1 | 8,05 | 8,10 | 8,05 | 8,00 | 8,10 | ||
| 1 1 1 | 114±1 | 9,37 | 9,36 | 9,37 | 9,36 | 9,35 |
The results of experimental data processing are shown in the following table:
| № | Q 3 Q 2 Q 1 | R E, Ohm | U Wed, AT | U cf. env. , AT | Δ U Wed, AT | Δ U and, AT | Δ U about, AT | Δ U in, AT | Δ U, AT | U, AT |
| 0 0 0 | 0,00 | 0,00 | 0,00 | 0,01 | 0,01 | 0,00 | 0,02 | 0.00±0.02 | ||
| 0 0 1 | 800±1 | 1,362 | 1,36 | 0,0192 | 0,01 | 0,01 | 0,002 | 0,0412 | 1.36±0.04 | |
| 0 1 0 | 400±1 | 2,666 | 2,67 | 0,0264 | 0,01 | 0,01 | 0,004 | 0,0504 | 2.67±0.05 | |
| 0 1 1 | 267±1 | 4,02 | 4,02 | 0,036 | 0,01 | 0,01 | 0,00 | 0,056 | 4.02±0.06 | |
| 1 0 0 | 200±1 | 5,35 | 5,35 | 0,036 | 0,01 | 0,01 | 0,00 | 0,056 | 5.35±0.06 | |
| 1 0 1 | 160±1 | 6,714 | 6,71 | 0,0336 | 0,01 | 0,01 | 0,004 | 0,0576 | 6.71±0.06 | |
| 1 1 0 | 133±1 | 8,06 | 8,06 | 0,096 | 0,01 | 0,01 | 0,00 | 0,116 | 8.06±0.12 | |
| 1 1 1 | 114±1 | 9,362 | 9,36 | 0,0192 | 0,01 | 0,01 | 0,002 | 0,0412 | 9.36±0.04 |
We build a graph of the dependence of the output voltage on the value of the equivalent resistance U = f(R E).
When constructing a graph, the line length corresponds to the measurement error Δ U, individual for each experiment (maximum error Δ U= 0.116 V, which corresponds to approximately 2.5 mm on the graph at the selected scale). The line thickness corresponds to the measurement error of the equivalent resistance. The resulting graph is shown in Fig. 17.

Rice. 17. Graph of the dependence of the output voltage
from the value of the equivalent resistance in section AB
The graph resembles an inverse proportional graph. In order to verify this, we plot the dependence of the output voltage on the reciprocal value of the equivalent resistance U = f(1/R E), that is, from the conductivity σ chains. For convenience, the data for this graph will be presented in the form of the following table:
The resulting graph (Fig. 18) confirms the above assumption: the output voltage at the load resistance R n1 inversely proportional to the equivalent resistance of the circuit section AB: U = 0,0017/R E.
We choose another object of study: RI No. 2 - another value of the load resistance R H2, and perform the same steps. We get a similar result, but with a different coefficient k.
We formulate the answer to the PZ: the output voltage at the load resistance R n inversely proportional to the value of the equivalent resistance of a circuit section consisting of three conductors connected in parallel, which can be included in one of eight combinations.

Rice. 18. Graph of the dependence of the output voltage on the conductivity of the circuit section AB
Note that the scheme under consideration is digital-to-analog converter (DAC) - a device that converts a digital code (in this case, binary) into an analog signal (in this case, into voltage).
Planning Activities for a Solution cognitive task № 4
Experimental finding of a specific value of a specific physical quantity(solution of cognitive task No. 4) can be carried out in two situations: 1) the method for finding the specified physical quantity is unknown and 2) the method for finding this quantity has already been developed. In the first situation, there is a need to develop a method (system of actions) and select equipment for its practical implementation. In the second situation, there is a need to study this method, that is, to find out what equipment should be used for the practical implementation of this method and what should be the system of actions, the sequential execution of which will allow obtaining a specific value of a specific quantity in a specific situation. Common to both situations is the expression of the required quantity in terms of other quantities, the value of which can be found by direct measurement. It is said that in this case the person makes an indirect measurement.
Quantity values obtained by indirect measurement are inaccurate. This is understandable: they are based on the results of direct measurements, which are always inaccurate. In this regard, the system of actions for solving cognitive task No. 4 must necessarily include actions for calculating errors.
To find errors indirect measurements two methods have been developed: the method of error limits and the method of limits. Consider the content of each of which.
Error Bound Method
The error bound method is based on differentiation.
Let the indirectly measured quantity at is a function of several arguments: y = f(X 1 , X 2 , …, X N).
Quantities X 1, X 2, ..., X n measured by direct methods with absolute errors Δ X 1,Δ X 2 , …,Δ X N. As a result, the value at will also be found with some error Δ y.
Usually Δ x1<< Х 1, Δ X 2<< Х 2 , …, Δ X N<< Х n , Δ y<< у. Therefore, we can go to infinitesimal values, that is, replace Δ X 1,Δ X 2 , …,Δ XN,Δ y their differentials dX 1, dX 2, ..., dX N, dy respectively. Then the relative error
the relative error of a function is equal to the differential of its natural logarithm.
In the right side of the equality, instead of differentials of variables, their absolute errors are substituted, and instead of the quantities themselves, their average values. In order to determine the upper limit of the error, the algebraic summation of errors is replaced by arithmetic.
Knowing the relative error, find the absolute error
Δ at= ε u ּu,
where instead of at substitute the value obtained as a result of the measurement
U ism = f (<X 1>, <Х 2 >, ..., <Х n > ).
All intermediate calculations are performed according to the rules of approximate calculations with one spare digit. The final result and errors are rounded off according to general rules. The answer is written as
Y = Y meas± Δ At; ε y \u003d ...
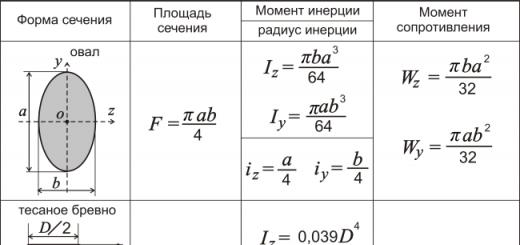
Expressions for relative and absolute errors depend on the type of function y. The main formulas that are often encountered in laboratory work are presented in Table 5.
For this task, you can get 2 points on the exam in 2020
Task 11 of the USE in physics is devoted to the basics of thermodynamics and molecular kinetic theory. The general theme of this ticket is the explanation of various phenomena.
Task 11 of the Unified State Examination in physics is always built in the same way: the student will be offered a graph or description of any dependence (heat energy release when a body is heated, changes in gas pressure depending on its temperature or density, any processes in an ideal gas). After that, five statements are given, directly or indirectly related to the topic of the ticket and representing a textual description of thermodynamic laws. Of these, the student must select two statements that he considers true, corresponding to the condition.
Task 11 of the Unified State Examination in Physics usually scares students, because it contains a lot of digital data, tables, and graphs. In fact, it is theoretical, and the student will not have to calculate anything when answering the question. Therefore, in fact, this question usually does not cause any special difficulties. However, the student must adequately assess his abilities and it is not recommended to “stay up” on the eleventh task, because the time to complete the entire test is limited to a certain number of minutes.
Job directory.
Part 2
Take the test for these tasks
Back to job catalog
Version for printing and copying in MS Word
In the process of boiling a liquid, preheated to the boiling point, the energy imparted to it goes
1) to increase the average speed of the molecules
2) to increase the average speed of movement of molecules and to overcome the forces of interaction between molecules
3) to overcome the forces of interaction between molecules without increasing the average speed of their movement
4) to increase the average speed of movement of molecules and to increase the forces of interaction between molecules
Decision.
When boiling, the temperature of the liquid does not change, but the process of transition to another state of aggregation occurs. The formation of another state of aggregation occurs with overcoming the forces of interaction between molecules. The constancy of temperature also means the constancy of the average velocity of the molecules.
Answer: 3
Source: GIA in Physics. main wave. Option 1313.
An open container of water is placed in a laboratory, which maintains a certain temperature and humidity. The rate of evaporation will be equal to the rate of condensation of water in the vessel
1) only if the temperature in the laboratory is more than 25 °C
2) only under the condition that the humidity in the laboratory is 100%
3) only on condition that the temperature in the laboratory is less than 25 ° C, and the air humidity is less than 100%
4) at any temperature and humidity in the laboratory
Decision.
The rate of evaporation will be equal to the rate of condensation of water in the vessel only if the humidity in the laboratory is 100%, regardless of temperature. In this case, dynamic equilibrium will be observed: how many molecules evaporated, the same number condensed.
The correct answer is numbered 2.
Answer: 2
Source: GIA in Physics. main wave. Option 1326.
1) to heat 1 kg of steel by 1 °C, it is necessary to spend 500 J of energy
2) to heat 500 kg of steel by 1 °C, it is necessary to expend 1 J of energy
3) to heat 1 kg of steel by 500 °C, it is necessary to expend 1 J of energy
4) to heat 500 kg of steel by 1 °C, it is necessary to spend 500 J of energy
Decision.
Specific heat capacity characterizes the amount of energy that must be imparted to one kilogram of a substance for the one of which the body consists, in order to heat it by one degree Celsius. Thus, to heat 1 kg of steel by 1 °C, it is necessary to expend 500 J of energy.
The correct answer is numbered 1.
Answer: 1
Source: GIA in Physics. main wave. Far East. Option 1327.
The specific heat capacity of steel is 500 J/kg °C. What does this mean?
1) when 1 kg of steel is cooled by 1 ° C, energy of 500 J is released
2) when 500 kg of steel is cooled by 1 ° C, energy of 1 J is released
3) when cooling 1 kg of steel at 500 ° C, energy of 1 J is released
4) when cooling 500 kg of steel, 500 J of energy is released by 1 ° C
Decision.
Specific heat capacity characterizes the amount of energy that must be imparted to one kilogram of a substance in order to heat it by one degree Celsius. Thus, to heat 1 kg of steel by 1 °C, it is necessary to expend 500 J of energy.
The correct answer is numbered 1.
Answer: 1
Source: GIA in Physics. main wave. Far East. Option 1328.
Regina Magadeeva 09.04.2016 18:54
In the textbook of the eighth grade, my definition of specific heat capacity looks like this: a physical quantity numerically equal to the amount of heat that must be transferred to a body with a mass of 1 kg in order for its temperature! to change! by 1 degree. The solution says that the specific heat capacity is needed in order to heat up by 1 degree.