Introduction
2. Basic concepts of mathematical statistics
2.1 Basic concepts of sampling
2.2 Sampling
2.3 Empirical distribution function, histogram
Conclusion
Bibliography
Introduction
Mathematical statistics is the science of mathematical methods of systematization and use of statistical data for scientific and practical conclusions. In many of its branches, mathematical statistics is based on the theory of probability, which makes it possible to assess the reliability and accuracy of conclusions drawn from limited statistical material (for example, to estimate the required sample size to obtain results of the required accuracy in a sample survey).
In probability theory, random variables with a given distribution or random experiments are considered, the properties of which are fully known. The subject of probability theory is the properties and relationships of these quantities (distributions).
But often the experiment is a black box, giving only some results, according to which it is required to draw a conclusion about the properties of the experiment itself. The observer has a set of numerical (or they can be made numerical) results obtained by repeating the same random experiment under the same conditions.
In this case, for example, the following questions arise: If we observe one random variable, how can we draw the most accurate conclusion about its distribution from a set of its values in several experiments?
An example of such a series of experiments is a sociological survey, a set of economic indicators, or, finally, a sequence of coats of arms and tails during a thousand-fold coin toss.
All of the above factors lead to relevance and the importance of the topic of work at the present stage, aimed at a deep and comprehensive study of the basic concepts of mathematical statistics.
In this regard, the purpose of this work is to systematize, accumulate and consolidate knowledge about the concepts of mathematical statistics.
1. Subject and methods of mathematical statistics
Mathematical statistics is the science of mathematical methods for analyzing data obtained during mass observations (measurements, experiments). Depending on the mathematical nature of the specific results of observations, mathematical statistics is divided into statistics of numbers, multivariate statistical analysis, analysis of functions (processes) and time series, and statistics of non-numerical objects. A significant part of mathematical statistics is based on probabilistic models. Allocate common tasks of data description, estimation and testing of hypotheses. They also consider more specific tasks related to conducting sample surveys, restoring dependencies, building and using classifications (typologies), etc.
To describe the data, tables, charts, and other visual representations are built, for example, correlation fields. Probabilistic models are usually not used. Some data description methods rely on advanced theory and the capabilities of modern computers. These include, in particular, cluster analysis, aimed at identifying groups of objects that are similar to each other, and multidimensional scaling, which makes it possible to visualize objects on a plane, distorting the distances between them to the least degree.
Estimation and hypothesis testing methods rely on probabilistic data generation models. These models are divided into parametric and non-parametric. In parametric models, it is assumed that the objects under study are described by distribution functions that depend on a small number (1-4) of numerical parameters. In nonparametric models, the distribution functions are assumed to be arbitrary continuous. In mathematical statistics, the parameters and characteristics of distribution (mathematical expectation, median, variance, quantiles, etc.), densities and distribution functions, dependencies between variables (based on linear and non-parametric correlation coefficients, as well as parametric or non-parametric estimates of functions expressing dependencies) are evaluated etc. Use point and interval (giving bounds for true values) estimates.
In mathematical statistics, there is a general theory of hypothesis testing and a large number of methods dedicated to testing specific hypotheses. Hypotheses are considered about the values of parameters and characteristics, about checking homogeneity (that is, about the coincidence of characteristics or distribution functions in two samples), about the agreement of the empirical distribution function with a given distribution function or with a parametric family of such functions, about the symmetry of the distribution, etc.
Of great importance is the section of mathematical statistics associated with conducting sample surveys, with the properties of various sampling schemes and the construction of adequate methods for estimating and testing hypotheses.
Dependency recovery problems have been actively studied for more than 200 years, since the development of the method of least squares by K. Gauss in 1794. Currently, the methods of searching for an informative subset of variables and non-parametric methods are the most relevant.
The development of methods for data approximation and description dimension reduction was started more than 100 years ago, when K. Pearson created the principal component method. Later, factor analysis and numerous non-linear generalizations were developed.
Various methods of constructing (cluster analysis), analysis and use (discriminant analysis) of classifications (typologies) are also called methods of pattern recognition (with and without a teacher), automatic classification, etc.
Mathematical methods in statistics are based either on the use of sums (based on the Central Limit Theorem of probability theory) or difference indicators (distances, metrics), as in the statistics of non-numerical objects. Usually only asymptotic results are rigorously substantiated. Nowadays computers play a big role in mathematical statistics. They are used both for calculations and for simulation modeling (in particular, in sampling methods and in studying the suitability of asymptotic results).
Basic concepts of mathematical statistics
2.1 Basic concepts of the sampling method
Let be a random variable observed in a random experiment. It is assumed that the probability space is given (and will not interest us).
We will assume that, having carried out this experiment once under the same conditions, we obtained the numbers , , , - the values of this random variable in the first, second, etc. experiments. A random variable has some distribution , which is partially or completely unknown to us.
Let's take a closer look at a set called a sample.
In a series of experiments already performed, a sample is a set of numbers. But if this series of experiments is repeated again, then instead of this set we will get a new set of numbers. Instead of a number, another number will appear - one of the values of a random variable. That is, (and , and , etc.) is a variable that can take the same values as the random variable , and just as often (with the same probabilities). Therefore, before the experiment - a random variable equally distributed with , and after the experiment - the number that we observe in this first experiment, i.e. one of the possible values of the random variable .
A sample of volume is a set of independent and identically distributed random variables (“copies”) that, like and , have a distribution.
What does it mean to “draw a conclusion about the distribution from a sample”? The distribution is characterized by a distribution function, density or table, a set of numerical characteristics - , , etc. Based on the sample, one must be able to build approximations for all these characteristics.
.2 Sampling
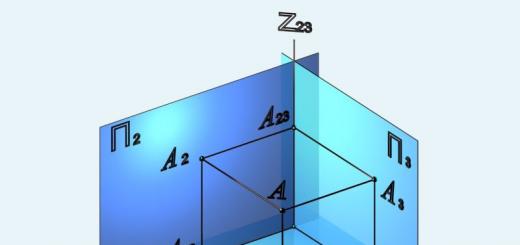
Consider the implementation of the sample on one elementary outcome - a set of numbers ![]() , ,
, , ![]() . On a suitable probability space, we introduce a random variable taking the values , , with probabilities in (if some of the values coincide, we add the probabilities the corresponding number of times). The probability distribution table and the random variable distribution function look like this:
. On a suitable probability space, we introduce a random variable taking the values , , with probabilities in (if some of the values coincide, we add the probabilities the corresponding number of times). The probability distribution table and the random variable distribution function look like this:
The distribution of a quantity is called the empirical or sample distribution. Let us calculate the mathematical expectation and variance of a quantity and introduce the notation for these quantities:
In the same way, we calculate the moment of order

In the general case, we denote by the quantity

If, when constructing all the characteristics introduced by us, we consider the sample , , as a set of random variables, then these characteristics themselves - , , , , - will become random variables. These sample distribution characteristics are used to estimate (approximate) the corresponding unknown characteristics of the true distribution.
The reason for using the characteristics of the distribution to estimate the characteristics of the true distribution (or ) is in the closeness of these distributions for large .
Consider, for example, tossing a regular die. Let be ![]() - the number of points that fell on the -th throw, . Let's assume that one in the sample will occur once, two - once, and so on. Then the random variable will take the values 1
, , 6
with probabilities , , respectively. But these proportions approach with growth according to the law of large numbers. That is, the distribution of magnitude in some sense approaches the true distribution of the number of points that fall out when the correct die is tossed.
- the number of points that fell on the -th throw, . Let's assume that one in the sample will occur once, two - once, and so on. Then the random variable will take the values 1
, , 6
with probabilities , , respectively. But these proportions approach with growth according to the law of large numbers. That is, the distribution of magnitude in some sense approaches the true distribution of the number of points that fall out when the correct die is tossed.
We will not specify what is meant by the closeness of the sample and true distributions. In the following paragraphs, we will take a closer look at each of the characteristics introduced above and examine its properties, including its behavior with increasing sample size.
.3 Empirical distribution function, histogram
Since the unknown distribution can be described, for example, by its distribution function , we will construct an “estimate” for this function from the sample.
Definition 1.
An empirical distribution function built on a sample of volume , is called a random function , for each equal to
Reminder: random function

called an event indicator. For each, this is a random variable having a Bernoulli distribution with parameter . why?
In other words, for any value of , equal to the true probability of the random variable being less than , the proportion of sample elements less than is estimated.
If the sample elements , , are sorted in ascending order (on each elementary outcome), a new set of random variables will be obtained, called a variation series:
The element , , is called the th member of the variational series or the th order statistic .
Example 1
Sample:
Variation row:
| Rice. one. Example 1 |
 |
The empirical distribution function has jumps at sample points, the jump value at the point is , where is the number of sample elements that match with .
It is possible to construct an empirical distribution function for the variational series:

Another characteristic of a distribution is the table (for discrete distributions) or the density (for absolutely continuous distributions). An empirical, or selective analogue of a table or density is the so-called histogram.
The histogram is based on grouped data. The estimated range of values of a random variable (or the range of sample data) is divided, regardless of the sample, into a certain number of intervals (not necessarily the same). Let , , be intervals on the line, called grouping intervals . Let us denote for by the number of sample elements that fall into the interval :
| (1) |
On each of the intervals, a rectangle is built, the area of \u200b\u200bwhich is proportional to. The total area of all rectangles must be equal to one. Let be the length of the interval. The height of the rectangle above is
The resulting figure is called a histogram.
Example 2
There is a variation series (see example 1):
Here is the decimal logarithm, therefore, i.e. when the sample is doubled, the number of grouping intervals increases by 1. Note that the more grouping intervals, the better. But, if we take the number of intervals, say, of the order of , then with growth the histogram will not approach density.
The following statement is true:
If the distribution density of the sample elements is a continuous function, then for so that , there is a pointwise convergence in probability of the histogram to the density.
So the choice of the logarithm is reasonable, but not the only possible one.
Conclusion
Mathematical (or theoretical) statistics is based on the methods and concepts of probability theory, but in a sense it solves inverse problems.
If we observe the simultaneous manifestation of two (or more) signs, i.e. we have a set of values of several random variables - what can be said about their dependence? Is she there or not? And if so, what is this dependence?
It is often possible to make some assumptions about the distribution hidden in the "black box" or about its properties. In this case, according to experimental data, it is required to confirm or refute these assumptions (“hypotheses”). At the same time, we must remember that the answer "yes" or "no" can only be given with a certain degree of certainty, and the longer we can continue the experiment, the more accurate the conclusions can be. The most favorable situation for research is when one can confidently assert about some properties of the observed experiment - for example, about the presence of a functional dependence between the observed quantities, about the normality of the distribution, about its symmetry, about the presence of density in the distribution or about its discrete nature, etc. .
So, it makes sense to remember about (mathematical) statistics if
there is a random experiment, the properties of which are partially or completely unknown,
We are able to reproduce this experiment under the same conditions some (or better, any) number of times.
Bibliography
1. Baumol W. Economic theory and research operations. – M.; Science, 1999.
2. Bolshev L.N., Smirnov N.V. Tables of mathematical statistics. Moscow: Nauka, 1995.
3. Borovkov A.A. Math statistics. Moscow: Nauka, 1994.
4. Korn G., Korn T. Handbook of mathematics for scientists and engineers. - St. Petersburg: Lan Publishing House, 2003.
5. Korshunov D.A., Chernova N.I. Collection of tasks and exercises in mathematical statistics. Novosibirsk: Publishing House of the Institute of Mathematics. S.L. Sobolev SB RAS, 2001.
6. Peheletsky I.D. Mathematics: textbook for students. - M.: Academy, 2003.
7. Sukhodolsky V.G. Lectures on higher mathematics for the humanities. - St. Petersburg Publishing House of St. Petersburg State University. 2003
8. Feller V. Introduction to the theory of probability and its applications. - M.: Mir, T.2, 1984.
9. Harman G., Modern factor analysis. - M.: Statistics, 1972.
Harman G., Modern factor analysis. - M.: Statistics, 1972.
Every investigation in the field of random phenomena is always rooted in experiment, in experimental data. Numerical data that is collected when studying any feature of some object is called statistical. Statistical data are the initial material of the study. In order for them to be of scientific or practical value, they must be processed by methods of mathematical statistics.
Math statistics is a scientific discipline, the subject of which is the development of methods for recording, describing and analyzing statistical experimental data obtained as a result of observations of massive random phenomena.
The main tasks of mathematical statistics are:
determination of the law of distribution of a random variable or a system of random variables;
testing the plausibility of hypotheses;
determination of unknown distribution parameters.
All methods of mathematical statistics are based on the theory of probability. However, due to the specificity of the problems being solved, mathematical statistics is separated from the theory of probability into an independent field. If in the theory of probability the model of the phenomenon is considered to be given and the possible real course of this phenomenon is calculated (Fig. 1), then in mathematical statistics an appropriate theoretical and probabilistic model is selected based on statistical data (Fig. 2).
Fig.1. General problem of probability theory
Fig.2. General problem of mathematical statistics
As a scientific discipline, mathematical statistics developed along with the theory of probability. The mathematical apparatus of this science was built in the second half of the 19th century.
2. General population and sample.
To study statistical methods, the concepts of general and sample populations are introduced. In general, under general population is understood as a random variable X with the distribution function  . A sample set or a sample of volume n for a given random variable X is a set
  independent observations of this quantity, where
  is called the sample value or implementation of the random variable X. Thus,
  can be considered as numbers (if the experiment is carried out and the sample was taken) and as random variables (before the experiment), since they vary from sample to sample.
Example 1. To determine the dependence of the thickness of a tree trunk on its height, 200 trees were selected. In this case, the sample size is n=200.
Example 2 As a result of sawing particle boards on a circular saw, 15 values of the specific cutting work were obtained. In this case, n=15.
D  In order to confidently judge the feature of the general population that we are interested in according to the sample data, the objects of the sample must correctly represent it, that is, the sample must be representative(representative). The representativeness of the sample is usually achieved by random selection of objects: each object of the general population is provided with an equal probability of being included in the sample with all the others.
Fig.3. Demonstration of the representativeness of the sample
Math statistics
Subject and Methods
Mathematical statistics is a branch of mathematics that develops methods for recording, describing and analyzing observational and experimental data in order to build probabilistic models of mass random phenomena. Depending on the mathematical nature of the specific results of observations, mathematical statistics is divided into statistics of numbers, multivariate statistical analysis, analysis of functions (processes) and time series, and statistics of non-numerical objects.
Nowadays computers play a big role in mathematical statistics. They are used both for calculations and for simulation modeling (in particular, in sampling methods and in studying the suitability of asymptotic results).
Notes
Literature
- Probability and mathematical statistics. Encyclopedia / Ch. ed. Yu. V. Prokhorov. - M.: Publishing House "Big Russian Encyclopedia", 1999.
- Wald A. Consistent analysis, trans. from English - M.: Fizmatgiz, 1960.
- Shiryaev A. N. Statistical sequential analysis. Optimal stopping rules - M.: Nauka, 1976
see also
Links
Wikimedia Foundation. 2010 .
- Linear algebra
- Mathematical physics
See what "Mathematical statistics" is in other dictionaries:
MATH STATISTICS Modern Encyclopedia
MATH STATISTICS- the science of mathematical methods of systematization and use of statistical data for scientific and practical conclusions. In many of its branches, mathematical statistics is based on the theory of probability, which allows one to evaluate the reliability and accuracy ... Big Encyclopedic Dictionary
Math statistics- MATHEMATICAL STATISTICS, the science of mathematical methods of systematization and use of statistical data for scientific and practical conclusions. The origins of mathematical statistics can be found in the works of scientists of the late 17th and early 19th centuries. In many… … Illustrated Encyclopedic Dictionary
MATH STATISTICS- a science that deals with the description and analysis of the results of observations of mass phenomena using the methods of probability theory. Typical tasks of M. with. determining the types of distributions of a random variable, testing statistical hypotheses, estimating parameters, etc ... Geological Encyclopedia
MATH STATISTICS- (from lat. status - state). Related to the methodology of teaching languages, the science of mathematical methods of systematization and use of statistical data for scientific and practical conclusions. Laws of M. with. widely used in the organization ... ... A new dictionary of methodological terms and concepts (theory and practice of teaching languages)
Math statistics- a branch of mathematics devoted to the methods and rules for processing and analyzing statistical data (i.e., information about the number of objects that have certain characteristics, in any more or less extensive set). Themselves… … Economic and Mathematical Dictionary
math statistics- A section of mathematics devoted to the methods and rules for processing and analyzing statistical data (ie, information about the number of objects that have certain characteristics, in any more or less extensive set). The methods and rules themselves are built ... ... Technical Translator's Handbook
Math statistics- a section of mathematics devoted to mathematical methods of systematization, processing and use of statistical data for scientific and practical conclusions. At the same time, statistical data refers to information about the number of objects in any ... ... Great Soviet Encyclopedia
math statistics- the science of mathematical methods of systematization and use of statistical data for scientific and practical conclusions. In many of its sections, mathematical statistics is based on the theory of probability, which allows one to evaluate the reliability and accuracy ... encyclopedic Dictionary
“Some people think they are always right. Such people could neither be good scientists nor have any interest in statistics… The case was brought down from heaven to earth, where it became part of the world of science.” (Dimend S.)
“Chance is only a measure of our ignorance. Random phenomena, if we define them, will be those whose laws we do not know. (A. Poincare "Science and Hypothesis")
“Glory to the occasion. Isn't it a case
Always on a par with the immutable ...
Chance often rules the event,
Generates both joy and pain.
And life puts a task before us:
How to comprehend the role of chance "
(from the book by B.A. Kordemsky “Mathematics studies randomness”)
The world itself is logical - this is how we often think and study the laws of physics, chemistry, etc., and yet nothing happens without the intervention of chance, arising under the influence of inconsistent, side causal relationships that change the course of a phenomenon or experience when it is repeated. A “random effect” is created with the inherent regularity of “hidden predestination”, i.e. chance has a need for a regular outcome.
Mathematicians consider random events only in the dilemma "to be or not to be" - to come or not to come.
Definition. The branch of applied mathematics that studies the quantitative characteristics of mass random events or phenomena is called mathematical statistics.
Definition. The combination of elements of probability theory and mathematical statistics is called stochastics.
Definition. Stochastic- this is the branch of mathematics that arose and is developing in close connection with the practical activities of man. Today, elements of stochastics are included in mathematics for everyone, becoming a new, important aspect of mathematical and general education.
Definition. Math statistics- the science of mathematical methods of systematization, processing and use of statistical data for scientific and practical conclusions.
Let's talk about this in more detail.
The point of view on mathematical statistics as a science of general methods of processing the results of an experiment is now generally accepted. In solving these problems, what should an experiment have in order for the judgments made on its basis to be correct. Mathematical statistics is partly becoming the science of experimental design.
The meaning of the word "statistics" over the past two centuries has undergone significant changes, write the famous modern scientists Hodges and Lehman, - the word "statistics" has the same root as the word "state" (state) and originally meant the art and science of management: the first teachers of university statistics Germany in the 18th century would today be called social scientists. Because government decisions are to some extent based on data on population, industry, etc. statisticians, of course, became interested in such data, and gradually the word "statistics" began to mean the collection of data about the population, about the state, and then in general the collection and processing of data. There is no point in extracting data if there is no benefit to be derived from it, and statisticians naturally get involved in interpreting the data.
The modern statistician studies methods by which inferences can be made about a population from data that is usually obtained from a sample of a "population".
Definition. Statistician- a person who deals with the science of mathematical methods of systematization, processing and use of statistical data for scientific and practical conclusions.
Mathematical statistics originated in the 17th century and developed in parallel with probability theory. The further development of mathematical statistics (the second half of the 19th and early 20th centuries) is due primarily to P.L. Chebyshev, A.A. Markov, A.M. Lyapunov, K. Gauss, A. Quetelet, F. Galton, K Pearson, and others. In the 20th, the most significant contribution to mathematical statistics was made by A.N. Kolmogorov, V.I. Romanovsky, E.E. Slutsky, N.V. Smirnov, B.V. Gnedenko, as well as English Student, R. Fisher, E. Purson and American (Yu. Neumann, A Wald) scientists.
Problems of mathematical statistics and the meaning of error in the world of science
Establishment of patterns to which mass random phenomena are subject is based on the study of statistical data of observation results by methods of probability theory.
The first task of mathematical statistics is to indicate the methods of collecting and grouping statistical information obtained as a result of observations or as a result of specially designed experiments.
The second task of mathematical statistics is to develop methods for analyzing statistical data depending on the objectives of the study.
Modern mathematical statistics is developing ways to determine the number of required tests before the start of the study (experiment planning), during the study (sequential analysis). It can be defined as the science of decision making under uncertainty.
Briefly, we can say that the task of mathematical statistics is to create methods for collecting and processing statistical data.
When studying a mass random phenomenon, it is assumed that all tests are carried out under the same conditions, i.e. the group of main factors that can be taken into account (measured) and have a significant impact on the test result, retains the same values as far as possible.
Random factors distort the result that would have been obtained if only the main factors were present, making it random. The deviation of the result of each test from the true one is called the error of observation, which is a random variable. It is necessary to distinguish between systematic and random errors.
A scientific experiment is unthinkable without error, like the ocean without salt. Any stream of facts that adds to our knowledge brings some kind of error. According to a well-known saying in most people's lives, nothing can be sure, except death and taxes, and the scientist adds: "And the errors of experience."
A statistician is a "hound" who hunts for a bug. Statistics tool for error detection.
The word "mistake" does not simply mean "miscalculation". The consequences of miscalculation are a small and relatively uninteresting source of experimental error.
Indeed, our tools break; our eyes and ears can deceive us; our measurements are never perfectly accurate, sometimes even our arithmetical calculations are wrong. An experimental error is something more essential than an inaccurate tape measure or an optical illusion. And since the most important job of statistics is to help scientists analyze experimental error, we must try to understand what error really is.
Whatever problem a scientist works on, it will certainly turn out to be more complex than he would like. Suppose it measures radioactive fallout at different latitudes. The results will depend on the altitude of the places where the samples were collected, on the amount of local precipitation and on high-altitude cyclones over a wider area.
Experimental error is an integral part of any truly scientific experience.
The same result can be error and information depending on the problem and point of view. If a biologist wishes to investigate how a change in diet affects growth, then the presence of a related constitution is a source of error; if he studies the relationship between heredity and growth, the source of error will be differences in nutrition. If a physicist wants to investigate the relationship between electrical conductivity and temperature, differences in the density of the conducting material are a source of error; if he studies the relationship between this density and electrical conductivity, temperature changes will be a source of error.
This use of the word error may seem dubious, and perhaps it would be preferable to say that the resulting effects are distorted by "unintended" or "undesirable" influences. We plan an experiment to study known influences, but random factors that we are unable to foresee or analyze distort the results by adding their own effects to them.
The difference between planned effects and effects due to accidental causes is like the difference between the movements of a ship on the sea, sailing along a certain course, and a ship drifting aimlessly at the behest of changing winds and currents. The movement of the second ship can be called random movement. It is possible that this ship can come to any port, but it is more likely that it will not come to any particular place.
Statisticians use the word "random" to denote a phenomenon whose outcome at a forthcoming point in time is completely impossible to predict.
The error due to the effects envisaged in the experiment is sometimes more systematic than random.
Systematic error is more misleading than random error. Interference from another radio station can create a systematic musical accompaniment that you can sometimes predict if you know the tune. But this "accompaniment" can cause us to make the wrong judgment about the words or music of the program we are trying to hear.
However, the discovery of a systematic error often leads us on the trail of a new discovery. Knowing how random errors occur helps us detect systematic errors and therefore eliminate them.
The same character of reasoning is common in our worldly affairs. How often do we notice: “This is not an accident!”. Whenever we can say that, we are on the path to discovery.
For example, A.L. Chizhevsky, analyzing historical processes: an increase in mortality, epidemics, the outbreak of wars, great migrations of peoples, abrupt climate changes, etc. discovered the relationship between these unrelated processes and periods of solar activity, which have cycles: 11 years, 33 years.
Definition. under systematic error is understood as an error that is repeated and the same for all tests. It is usually associated with the wrong conduct of the experiment.
Definition. Under random mistakes refers to errors arising under the influence of random factors and changing randomly from experience to experience.
Usually, the distribution of random errors is symmetrical about zero, which leads to an important conclusion: in the absence of systematic errors, the true test result is the mathematical expectation of a random variable, the specific value of which is fixed in each test.
The objects of study in mathematical statistics can be qualitative or quantitative features of the phenomenon or process being studied.
In the case of a qualitative trait, the number of occurrences of this trait in the considered series of experiments is counted; this number is the (discrete) random variable under study. Examples of quality attributes are defects on a finished part, demographics, and so on. If the sign is quantitative, then in the experiment a direct or indirect measurement is made by comparison with a certain standard - a unit of measurement - using various measuring instruments. For example, if there is a batch of parts, then the standard of the part can serve as a qualitative sign, and the controlled size of the part can serve as a quantitative sign.
Basic definitions
A significant part of mathematical statistics is associated with the need to describe a large set of objects.
Definition. The whole set of objects to be studied is called the general population.
The general population can be the entire population of the country, the monthly production of the plant, the population of fish living in a given reservoir, etc.
But the general population is not just a set. If the set of objects of interest to us is too numerous, or the objects are difficult to access, or there are other reasons that do not allow studying all the objects, they resort to studying some part of the objects.
Definition. That part of the objects that got to check, study, etc., is called sample population or simply sample.
Definition. The number of elements in the general population and sample is called their volumes.
How to ensure that the sample best represents the whole, i.e. would be representative?
If an integer, i.e. if the general population is little or completely unknown to us, nothing better can be offered than a purely random choice. Greater awareness allows you to act better, but still at some stage ignorance sets in and, as a result, random choice.
But how to make a purely random selection? As a rule, selection is based on easily observable traits, for the study of which research is being conducted.
Violation of the principles of random selection led to serious errors. A poll conducted by the American magazine Literaturnoye Obozrenie on the outcome of the presidential election in 1936 became famous for its failure. The candidates in this election were F.D. Roosevelt and A.M. Landon.
Who has won?
As a general population, the editors used telephone books. After randomly selecting 4 million addresses, she sent out postcards with questions about the attitude towards presidential candidates throughout the country. After spending a large sum on mailing and processing postcards, the magazine announced that Landon would win the upcoming presidential election by a landslide. The election result turned out to be the opposite of this forecast.
There were two mistakes made here. First, phone books do not provide a representative sample of the US population - mostly wealthy heads of families. Secondly, not all people sent answers, but a significant part of the representatives of the business world, who supported Landon.
At the same time, sociologists J. Gallan and E. Warner correctly predicted the victory of F.D. Roosevelt, based on only four thousand questionnaires. The reason for this success was not only the correct selection of the sample. They took into account that society is breaking up into social groups that are more homogeneous in relation to presidential candidates. Therefore, the sample from the layer can be relatively small with the same accuracy result. In the end, Roosevelt won, who was a supporter of reforms for the less wealthy segments of the population.
Having the results of the survey by layers, it is possible to characterize society as a whole.
What are samples?
These are rows of numbers.
Let us dwell in more detail on the basic concepts that characterize the sample series.
A sample of size n was taken from the general population > n 1 , where n 1 is the number of times the appearance of x 1 , n 2 - x 2 , etc. was observed.
The observed values of x i are called options, and the sequence of options written in ascending order is called a variation series. Numbers of observations n i are called frequencies and n i /n - relative frequencies (or frequencies).
Definition. Different values of a random variable are called options.
Definition. variation series called a series arranged in ascending (or descending) order of options with their corresponding frequencies (frequencies).
When studying variational series, along with the concepts of frequency, the concept of accumulated frequency is used. The accumulated frequencies (frequencies) for each interval are found by successive summation of the frequencies of all previous intervals.
Definition. The accumulation of frequencies or frequencies is called cumulation. You can cumulate frequency options and intervals.
Characteristics of a series can be quantitative and qualitative.
Quantitative (variational) characteristics are characteristics that can be expressed in numbers. They are divided into discrete and continuous.
Qualitative (attribute) characteristics are characteristics that are not expressed by numbers.
Continuous variables are variables that are expressed as real numbers.
Discrete Variables are variables that are expressed only as integers.
Samples are characterized central trends: mean, mode and median. The mean value of the sample is the arithmetic mean of all its values. The sample mode is the values that occur most frequently. The sample median is the number that “divides” the ordered set of all sample values in half.
The variation series can be discrete or continuous.
Task
Given sample: 1.3; 1.8; 1.2; 3.0; 2.1; 5; 2.4; 1.2; 3.2;1.2; 4; 2.4.
It's a range of options. Arranging these options in ascending order, we get a variation series: 1.2; 1.2; 1.2; 1.3; 1.8; 2.1; 2.4; 2.4; 3.0; 3.2; 4; 5.
The average value of this series is 2.4.
The median of the series is 2.25.
The mode of the series is -1,2.
Let's define these concepts.
Definition. The median of the variation series that value of a random variable is called, which falls in the middle of the variational series (Me).
The median of an ordered series of numbers with an odd number of members is the number written in the middle, and the median of an ordered series of numbers with an even number of members is the arithmetic mean of the two numbers written in the middle. The median of an arbitrary series of numbers is the median of the corresponding ordered series.
Definition. Vogue series name the variant (the value of a random variable), which corresponds to the highest frequency (Mo), i.e. which is more common than others.
Definition. The arithmetic mean of the variation series the result of dividing the sum of values of a statistical variable by the number of these values, that is, by the number of terms, is called.
The rule for finding the arithmetic mean of the sample:
- multiply each option by its frequency (multiplicity);
- add up all the resulting works;
- divide the found sum by the sum of all frequencies.
Definition. Sweep row is the difference between R=x max -x min , i.e. the largest and smallest values of these options.
Let's check whether we have found the average value of this series, the median and the mode correctly, based on the definitions.
We counted the number of members, there are 12 of them - an even number of members, so you need to find the arithmetic mean of the two numbers written in the middle, that is, the 6th and 7th options. (2.1+2.4) \ 2 \u003d 2.25 - median.
Fashion. The mod is 1.2 because only this number occurs 3 times, and the rest occur less than 3 times.
We find the arithmetic mean as follows:
(1,2*3+1,3+1,8+2,1+2,4*2+3,0+3,2 +4+5)\12=2,4
Let's make a table
Such tables are called frequency tables. In them, the numbers of the second line are frequencies; they show how often one or another of its values occurs in the sample.
Definition. Relative frequency sample values are the ratio of its frequency to the number of all sample values.
Relative frequencies are otherwise called frequencies. Frequencies and frequencies are called weights. Find the range of the series: R=5-1.2=3.8; The range of the series is 3.8.
Information for thought
The arithmetic mean is a conditional value. It doesn't really exist. In reality, there is a total. Therefore, the arithmetic mean is not a characteristic of one observation; it characterizes the series as a whole.
Mean can be interpreted as the center of dispersion of the values of the observed feature, i.e. value, around which all observed values fluctuate, and the algebraic sum of deviations from the mean is always equal to zero, i.e. the sum of deviations from the mean up or down are equal to each other.
Average is an abstract (generalizing) quantity. Even when specifying a series of only natural numbers, the average value can be expressed as a fractional number. Example: the average test score is 3.81.
Mean is found not only for homogeneous quantities. Average grain yield throughout the country (corn - 50-60 centners per hectare and buckwheat - 5-6 centners per hectare, rye, wheat, etc.), average food consumption, average national income per capita , average housing supply, weighted average housing cost, average labor intensity of building construction, etc. - these are the characteristics of the state as a single national economic system, these are the so-called system averages.
In statistics, such characteristics are widely used as mode and median. They are called structural averages, because the values of these characteristics are determined by the general structure of the data series.
Sometimes a row may have two modes, sometimes a row may not have a mode.
Fashion is the most acceptable indicator in identifying the packaging of some product, which is preferred by buyers; prices for goods of this type, common in the market; like shoe size, clothing, most in demand; a sport that is preferred by the majority of the population of the country, city, school village, etc.
In construction, there are 8 options for slabs in width, and 3 types are more often used: 1 m. 1.2 m. and 1.5 m. There are 33 slab options in length, but 4.8 m long slabs are most often used; 5.7 m and 6.0 m, the slab fashion is the most common among these 3 sizes. The same can be said about window brands.
The mode of a series of data is found when they want to identify some typical indicator.
The mode can be expressed in numbers and words, in terms of statistics, the mode is the frequency extremum.
Median allows you to take into account information about a series of data, which gives the arithmetic mean and vice versa.
Mathematical statistics is a branch of mathematics devoted to mathematical methods of systematization, processing and use of statistical data for scientific and practical purposes..
Statistical data refers to information about the number and nature of objects in any more or less extensive collection that have certain properties.
The method of research, based on the consideration of statistical data from certain sets of objects, is called statistical.
The formal mathematical side of statistical research methods is indifferent to the nature of the objects under study and is the subject of mathematical statistics.
The main task of mathematical statistics is to draw conclusions about mass phenomena and processes from observations or experiments.
Statistics is a science that allows you to see patterns in the chaos of random data, highlight the established connections in them and determine our actions in order to increase the share of correctly made decisions.
Many currently known dependencies between various aspects of the world around us have been obtained by analyzing the data accumulated by mankind. After the statistical discovery of dependencies, a person already finds one or another rational explanation for the discovered patterns.
To present the initial definitions of statistics, we turn to an example.
Example. Let's assume that it is necessary to estimate the degree of change in the IQ for 3 years of study for 100 students. As an indicator, consider the ratio of the current coefficient to the previously measured coefficient (three years ago), multiplied by 100%.
We get a sequence of 100 random variables: 97.8; 97.0; 101.7; 132.5; 142; …; 122. Denote it through X.
Definition 1. The sequence of random variables X observed as a result of the study in statistics is called a feature.
Definition 2.Different characteristic values are called variants.
It is difficult to obtain some information about the dynamics of changes in the IQ in the learning process from the given values of the variant. Let's sort this sequence in ascending order: 94; 97.0; 97.8; …142. Some useful information can already be extracted from the resulting sequence - for example, it is easy to determine the minimum and maximum values of a feature. But it is not clear how the trait is distributed among the entire population of the students surveyed. Let's break the options into intervals. According to the Sturges formula, the recommended number of intervals
m= 1+3.32l g(n)≈ 7.6, and the value of the interval .
The ranges of the obtained intervals are given in column 1 of the table.
Let's calculate how many values of the attribute fell into each interval, and write it in column 3.
Definition 3.The number showing how many options fell into the given i-th interval is called the frequency and is denoted by n i .
Definition 4.The ratio of frequency to the total number of observations is called the relative frequency (w i) or weight.
Definition 5.A variational series is a series of variants arranged in ascending or descending order with their corresponding weights.
For this example, the options are the midpoints of the intervals.
Definition 6.Accumulated frequency( )the number is called a variant with a feature value less than x (хОR).