Ministry of Education and Science of the Republic of Tatarstan
GAPOU "Leninogorsk Oil College"
Practical work No. 1
Subject :
“Hydraulic calculations for the application of the basic laws of hydrostatics ”.
OP 12 Hydraulics
Speciality 21.02.01. "Development and operation of oil and gas fields"
Speciality 21.02.02. "Drilling of oil and gas wells"
Well II
Developed by a teacher of special disciplines
M. I. Brendyureva
Leninogorsk, 2016
Objective : Be able to apply the laws of hydrostatics to solve practical problems.
Lesson equipment : guidelines, calculators, notebook, pen.
Methodical instructions: when solving problems, you first need to study the section “Hydrostatics” - basic concepts, the derivation of the basic equation of hydrostatics, fluid pressure on flat and curved surfaces. We solve problems in accordance with our version of the list.
Option 1
Task 1
It is necessary to determine the excess pressure in the deepest part of the World Ocean (at the bottom of the Mariinsky Trench), if its depthh, and the average density of water.
Task 2
Kerosene is stored in a tank on a water cushion. Layer of water highh 1 layer of kerosene h 2 . density of kerosene. Determine the force of pressure on the bottom.
assData
Options
h+ №, m
11000
9000
30 00
45 00
65 00
1040
1020
1030
1040
1035
h 1 + 0.2*№, m
0,45
h 2, m
kg/m 3
h, m
D+ 0.3*№, m
ρ , kg / m 3
1230
1200
1250
1300
1210
VU + No., 0 E
H+ №, m
Р 0, 10 5, Pa
0,15
0,18
B, m
ρ w, kg / m 3
1100
Task 3
Determine the pressure force on the bottom of a vertical cylindrical tank if the tank diameter isd, filled with oil to a heighth, oil density 900 kg/m 3 .
Task 4.
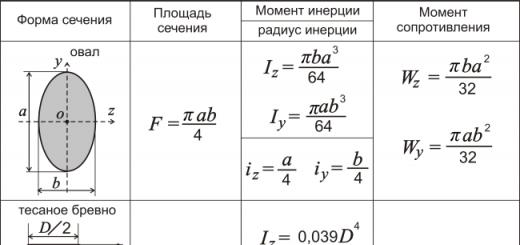
Conditional viscosity of bitumen emulsion at a temperature of 20 0 VU 0 E, the density is ρ. Determine the dynamic viscosity of the bitumen emulsion at the same temperature.
Task 5
h 0 , wall width b, fluid density ρ well.
Option 2
Task 1
Determine the excess pressure at the bottom of the well with a depthh, which is filled with a clay solution with a density of 1250 kg / m 3 .
Task 2
Determine the pressure experienced by the wall of a vessel filled with water at a depthh from the surface.
Task 3
Rectangular open tank designed for storageVwater. Determine the pressure forces on the walls and bottom of the tank, if the width of the bottomb, and the length.
Task 4
The tank is filledVoil density 800 kg/m 3 . How much oil should be filled with a density of 824 kg / m 3 so that the density of the mixture becomes equal to 814 kg / m 3 .
Task 5
Construct a diagram of the hydrostatic pressure of a liquid for a vertical wall, if the height of the wetted surface is H, up to half the height, a liquid with density ρ acts on the wall 1 , and the second half is affected by a liquid with a density ρ 2 .
assData
Options
H+ №, m
H+ 0.1*№, m
V+ №, m 3
V+ №, m 3
H + No, m
ρ 1, kg / m 3
ρ 2, kg / m 3
1100
1000
1100
1200
1000
Option 3
Task 1
Determine the pressure on the inner wall of an open channel filled with water at depthhfrom the surface if the barometric pressure is known to be P.
Task 2
An open vertical tank of square section with side a, filled with water to a height H. Determine the total water pressure on the side wall and on the bottom of the tank.
Task 3
Expanding to the bottom of the open tank sump has a bottom area of 1 m 2 , the level of settled water is equal toh 1 , oil level h 2 . Determine the pressure force on the bottom of the tank if ρ H \u003d 900 kg / m 3, ρ B \u003d 1000 kg / m 3.
Task 4
When testing the strength of the cylinder, it was filled with water at a pressure of P. After some time, as a result of leakage of part of the water through leaks, the pressure in the cylinder decreased by half. Balloon diameterd, height h. Determine the volume of water flowing out during the test.
assData
Options
h, m
Р + 10*№, mm. rt. Art.
a, m
h, m
h 1m
h 2, m
kg/m 3
P, kgf / cm 2
d, mm
H, mm
1200
1000
1200
1300
H, m
Р 0, 10 5, Pa
0,11
0,13
0,11
0,08
0,07
B, m
ρ w, kg / m 3
1000
1200
Task 5
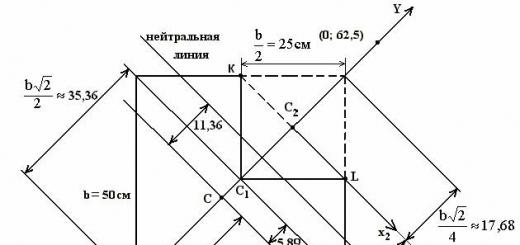
Construct a diagram of hydrostatic pressure for a flat wall, graphically determine the force of fluid pressure on the wall and the place of its application, if the height of the wetted surfaceh, pressure on the free surface of the liquid Р 0 , wall width b, fluid density ρ well.
Questions for self-control:
1. Explain what is called hydrostatic, vacuum and gauge pressure, in what units it is measured.
2. Explain how the basic law of hydrostatics is written.
3. Explain how the resulting pressure force on a flat wall is determined.
4. Explain how the resulting pressure force on a curved surface is determined.
The workshop presents descriptions of sixteen laboratory works in the discipline "Hydraulics", each of which includes a brief theory, guidelines for implementation and control questions. Reference material is included in the appendix. The glossary of terms consists of the concepts used and their definitions.
For students studying in the specialty 19060365 "Service of transport and technological machines and equipment (Motor transport)" and 19050062 "Operation of vehicles".
FOREWORD
The study of hydraulics by students of motor transport specialties provides for a certain amount of laboratory work. This collection contains descriptions of laboratory work and guidelines for their implementation.
The purpose of the laboratory workshop is to consolidate the material of the lecture course by students, develop the skills of independent work with devices during experiments, teach methods for determining the parameters of a moving fluid and performing calculations, as well as the ability to draw conclusions based on the results obtained.
Each job has 2 hours to complete. Since, when studying the discipline, part of the sections was transferred to students for independent study, the methodological instructions for each work briefly outline the theoretical material.
INTRODUCTION
Hydraulics is a technical science that studies the mechanical properties, laws of equilibrium and movement of fluids. The term "liquid" covers both droplets, practically incompressible liquids, and gaseous or compressible media.
The theoretical approach is based on the Euler continuity principle, according to which a liquid is considered not as a collection of its discrete material particles, but as a continuum, i.e. a continuous or continuous material medium that allows unlimited divisibility of its particles. Such a view of the structure of a substance is admissible if the dimensions of the volumes in which the phenomenon under study is considered are large enough compared to the dimensions of the molecules and their mean free path.
In hydraulics, experimental methods of research are widely used, which makes it possible to correct theoretical conclusions that deviate from real phenomena.
The main sections of practical hydraulics are: flow through pipes, outflow of fluid from holes and through nozzles, interaction of flow with obstacles, movement in porous media (filtration), and hydraulic machines.
LABORATORY WORKS
Topic 1. STUDY OF PHYSICAL PROPERTIES
LIQUIDS
Objective: master methods for measuring density, thermal expansion, viscosity and surface tension of liquids.
General information
A substance that is in a liquid state of aggregation (liquid phase) is called a liquid. The liquid state of aggregation is intermediate between the solid state, which is characterized by the preservation of its volume, the formation of a surface, the possession of a certain tensile strength, and the gaseous state, in which the substance takes the form of a vessel where it is enclosed. At the same time, the liquid has only its inherent property - fluidity, i.e. the ability to plastically or viscously deform under the action of any (including arbitrarily small) stresses. Fluidity is characterized by the value, inverse viscosity.
The main characteristics of a liquid are density, compressibility, thermal expansion, viscosity, and surface tension.
Density of a homogeneous substance is called the mass ratio m liquid to its volume W:
ρ = m/ W.
Compressibility- the property of a liquid to reduce volume under the action of uniform pressure. She's rated compressibility factor p, showing the relative decrease in the volume of liquid Δ W/W with increasing pressure Δ ρ per unit:
βρ = (Δ W/W)/Δ ρ .
thermal expansion- the property of a liquid to change volume when heated - is characterized, at constant pressure, coefficient of volumetric thermal expansion T, which is equal to the relative volume increment Δ W/W in case of temperature change T one degree:
β T =(Δ W/W)/Δ T.
As a rule, when heated, the volume of the liquid increases.
Viscosity(internal friction) - the property of fluid bodies to resist the movement of one of their parts relative to another. She is being evaluated dynamic viscosity coefficient , which has the dimension of Pa∙s. It characterizes the resistance of a liquid (gas) to the displacement of its layers.
Along with dynamic viscosity, calculations often use kinematic viscosity coefficientν, which is determined by the formula
ν = μ /ρ
and measure m 2 / s or stokes (1 St = 1 cm 2 / s).
The coefficients of dynamic and kinematic viscosity are determined by the type of fluid, do not depend on the flow velocity, and decrease significantly with increasing temperature.
Surface tension- thermodynamic characteristic of the interface between two phases, determined by the work of reversible isothermal formation of a unit area of this surface. In the case of a liquid interface, surface tension is considered as a force acting per unit length of the surface contour and tending to reduce the surface to a minimum for given phase volumes. Characterized surface tension , J / m 2 \u003d N / m. The work of forming a new surface is spent on overcoming the forces of intermolecular cohesion (cohesion) during the transition of substance molecules from the bulk of the body to the surface layer. The resultant of intermolecular forces in the surface layer is not equal to zero and is directed inside the phase in which the adhesion forces are greater. Thus, surface tension is a measure of the uncompensated intermolecular forces in the surface (interfacial) layer, or the excess of free energy in the surface layer compared to the free energy in the volumes of the phases.
The values of density, compressibility coefficients, volumetric thermal expansion, kinematic viscosity and surface tension at a temperature of 20°C are given in Table. Clause 3.1 of the application.
Description of the device to study
physical properties of the liquid
The device for studying the physical properties of a liquid contains 5 devices made in one transparent case (Fig. 1), on which the parameters necessary for processing the experimental data are indicated. Devices 3-5 begin to operate after turning the device 180 about. Thermometer 1 indicates the ambient temperature and therefore the temperature of the liquids in all appliances.
Rice. 1. Diagram of the device:
1 - thermometer; 2 - hydrometer; 3 – Stokes viscometer;
4 – capillary viscometer; 5 - stalagmometer
1.1. Coefficient definition
thermal expansion of the liquid
Thermometer 1 (Fig. 1) has a glass container with a capillary filled with thermometric liquid and a scale. The principle of its operation is based on the thermal expansion of liquids. A change in the ambient temperature leads to a corresponding change in the volume of the thermometric liquid and its level in the capillary. The level indicates the temperature value on the scale.
The coefficient of thermal expansion of a thermometric fluid is determined based on a thought experiment. It is assumed that the ambient temperature has increased from the lower (zero) to the upper limit value of the thermometer and the liquid level in the capillary has increased by l.
To determine the coefficient of thermal expansion, it is necessary:
2. Calculate the volume increment of the thermometric fluid
Δ W = π r 2 l,
where r is the radius of the thermometer capillary (indicated on the thermometer).
3. Taking into account the initial (at 0°С) volume of thermometric liquid W(the value is given on the thermometer) find the coefficient of thermal expansion β T = (Δ W/W)/Δ T and compare it with the reference value β T* (Table P. 3.1). Enter the values of the quantities used in the table. one.
Table 1
|
Liquid type |
r, |
W, |
Δ T, |
l, |
Δ W, |
β
T , |
β
T *
, |
Alcohol |
|
|
|
|
|
|
|
1.2. Measuring the density of a liquid with a hydrometer
Hydrometer 2 (Fig. 1) is used to determine the density of a liquid using the float method. It is a hollow cylinder with a millimeter scale and a weight at the bottom. Thanks to the load, the hydrometer floats in the liquid under study in a vertical position. The immersion depth of a hydrometer is a measure of the density of a liquid and is read from a scale along the upper edge of the liquid meniscus around the hydrometer. In conventional hydrometers, the scale is graduated in terms of density.
In the course of work, the following operations must be performed:
1. Measure the immersion depth h hydrometer on a millimeter scale on it.
2. Calculate the density of the liquid using the formula
ρ = 4m/(πd 2 h),
where m and d– mass and diameter of the hydrometer (values are given on the hydrometer).
This formula is obtained by equating the gravity of the hydrometer G = mg and buoyant (Archimedean) force F A = ρ gW, where the volume of the submerged part of the hydrometer W = hpd 2 /4.
3. Compare the experimental density value with reference value * (Table P. 3.1). The values of the quantities used are summarized in Table. 2.
table 2
Results of observations and calculations
|
MINISTRY OF EDUCATION AND SCIENCE OF THE RUSSIAN FEDERATION Togliatti State University Institute of Civil Engineering Department "Water supply and sanitation" METHODOLOGICAL INSTRUCTIONS to laboratory work on the discipline "HYDRAULICS" for academic advisor Togliatti 2007
UDC 532.5 (533.6) Guidelines for laboratory work in the discipline "Hydraulics" for students of construction specialties full-time education. /Comp. Kalinin A.V., Lushkin I.A. - Togliatti: TSU, 2006. The goals, objectives and program of laboratory work are outlined, instructions are given for preparing for work and their implementation. Il.12. Tab. 8. Bibliography: 5 titles. Compiled by: Kalinin A.V., Lushkin I.A. Scientific editor: Vdovin Yu.I. Approved by the editorial and publishing section of the Methodological Council of the Institute. © Togliatti State University, 2007 Instructions for laboratory work The basis of the course under study is the acquisition by students of the initial skills of conducting research, understanding the results of laboratory research, presenting and defending the results. Laboratory work is carried out in the laboratories of the department "Water supply and sanitation". In the course of the work, the student has the opportunity to see and study the phenomena occurring in the liquid, to measure physical quantities, master the methodology of setting up experiments, acquire the skills of processing the data obtained as a result of the experiment, presenting the results of the study. During the laboratory work, the student must learn how to use measuring instruments. Before conducting laboratory work, the student's knowledge of theoretical material on the topic of experimental research is monitored. Control is carried out by an academic consultant in a test form. A student is allowed to conduct laboratory work if he correctly answered 40% of the test questions. In laboratory works No. 4 and No. 5, the student must calculate the parameters of the physical model before conducting an experimental study. The results of the calculation are presented to the academic consultant. In the event that the calculation by the student has not been performed, the student is not allowed to the pilot study. The results of the conducted experimental study are presented in the form of a report. The report contains: the purpose of the work, the scheme of the installation, the main calculation formulas, tables of measurements and calculations, graphs, conclusions. The results of the study, after verification by an academic consultant, are used in the calculation of a short pipeline. Description of the universal hydraulic stand GS - 3 The universal hydraulic stand (see Fig. 1) is designed for laboratory and research work, the purpose of which is to study the laws of fluid motion. The hydrostand was developed at the Department of Thermal Engineering and Thermal Engines of the Samara State Aerodynamic University. The main elements of the hydrostand: pressure and receiving device; working area; pump; measuring devices. On the rack 4 there is a pressure tank 2 made of stainless steel in the form of a sphere. The pressure tank has an outlet pipe 3, to which the working section 15 is attached with the help of a seal. Water enters the pressure line from pump 9 when valve 8 is opened. During the experiment, supply valve 6 and drain valve 7 must be closed. The water flow through the working area is regulated by valve 18 at the outlet of the working area and by valve 8 Rice. 1. Scheme of the hydraulic stand The receiving device is a tank 22 connected to the drain line 12. Above the receiving tank on the console 10, a measuring tank 20 is mounted to measure the water flow. A tray 11 is installed on the console, used to collect water and drain it into a measuring tank 20. At the bottom of the measuring tank there is a valve 21 controlled by a lever mechanism Measuring devices are represented by a piezometric shield 13, on which seven glass tubes are mounted. The overpressure in the pressure tank is measured with a standard pressure gauge 1. When measuring the water flow, simultaneously with closing the valve on the control panel 5, an electric stopwatch is turned on. After filling with water a certain volume of the measuring tank (3 liters), the contact of the level switch closes with the simultaneous stop of the electric stopwatch. The hydraulic stand operates in a closed circuit with pumping water from the supply tank, draining it into the receiving tank and supplying it under pressure to the supply tank.
Laboratory work No. 1 Determining the value of the viscosity coefficient of water 1. The purpose of the work: experimental determination of the value of the viscosity coefficient and density of water at a given temperature. The results of the experiment are used in the calculation of a short pipeline. 2. Work program: 2.1. Determine the viscosity of water at a given temperature using an Engle viscometer 2.2. Measure the density of the liquid with a hydrometer. 2.3. Set the dynamic viscosity of the test fluid. 3. Description of the laboratory setup and measuring instruments Engler viscometer(Fig. 2) consists of a metal cylinder 1 with a spherical bottom with a hole. The hole is closed with a rod 2. When studying the dependence of a change in the viscosity of a liquid on temperature, the cylinder is placed in a water bath 3 with adjustable water heating. Fig 2. Engler viscometer The principle of operation of the hydrometer (see Fig. 3) is based on the use of the law of Archimedes, according to which the force of Archimedes acts vertically upwards on a body placed in a liquid. The magnitude of this force depends on the density of the liquid. The greater the density of the liquid in which the body is placed, the greater will be the Archimedes force that will push the body out of the liquid. It is possible to put marks on the body in the form of a float, corresponding to different values of density, and depending on how much such a “float” will be visible above the surface of the liquid, judge the density of this liquid. Rice. 3. Hydrometer
4. Order of performance of work: 4.1. Pour ≈ 250 cm 3 of the investigated liquid into cylinder 1 and place a measuring vessel under the hole. 4.2. With rod 2 we open a hole in the cylinder, at the same time turning on the stopwatch. 4.3. Determine the time τ 1 outflow from the cylinder of 200 cm3 of the investigated liquid at room temperature. The experiment is repeated at least 3 times. 4.4. Carefully wipe the cylinder and pour it into it with the bottom hole closed ≈ 250 cm 3 reference liquid (distilled water). 4.6. Determine the expiration time τ 2 reference fluid. 4.7. To determine the density ρ, the liquid under study is poured into a tall measuring cup. We lower the hydrometer into the glass and determine the density of the liquid using the hydrometer scale. 4.8. We determine the average expiration time τ 1sr and τ2sr τ cf = τ " + τ " + ... + τ n , n where n is the number of measurements. 4.9. Calculating degrees Engler ° E \u003d τ 1sr. τ 2sr 4.10. We determine the coefficient of kinematic viscosity ν according to the Ubelode formula ν = (0.0732° Oe − 0.0631 ° Oe) . 4.11. We find the dynamic viscosity coefficient μ using the formula ν = μ ρ . 4.12. The results of measurements and calculations are summarized in Table 1 and are used in the calculation of a short pipeline Table 1 5. Conclusions Viscosity of the test liquid
Laboratory work No. 2 Study of the laws of fluid motion 1. The purpose of the work: Experimental confirmation of the conclusions made during the study of the topic "Fundamentals of fluid dynamics and kinematics", the acquisition of skills in constructing a pressure line and a piezometric line of a short pipeline. 2. Work program: 2.1. Determine the pressure H at three points on the axis of the pipe, find the pressure loss. 2.2. Determine the flow velocity on the axis of the pipe. 2.3. Construct graphs of changes in the total head H and hydrostatic head H p along the length of the pipe. 3. Description of the installation. Laboratory work is carried out in the laboratory of hydraulics of the Department of V&V. The working section of the hydraulic stand, on which the work is carried out, is an inclined metal pipe of variable cross section (Fig. 4). Piezometric tubes and Pitot tubes are installed in sections 1-1, 2-2, 3-3, 4-4 and 5-5 to measure the static and total pressures of the liquid. The liquid flow rate in the pipe is controlled by a valve located at the end of the working section of the stand. Rice. 4. Scheme of the working section of the hydrostand 4. Order of performance of work: 4.1. We turn on the installation. 4.2. We open the valve at the end of the working section of the stand. 4.3. We measure the distance between pipe sections l and the ordinate z in each section. 4.3. After the air bubbles come out of the tubes, we record the readings of the piezometers and Pitot tubes in all sections. 4.4. Turn off the installation. 4.5. Determine the energy loss between sections h w 1− 2 = H 1 − H 2 , h w 2− 3 = H 2 − H 3 etc., where h w 1 - 2 - head loss between sections 1-1 and 2-2; h w 2 - 3 - pressure loss between sections 2-2 and 3-3; H 1, H 2, H 3 - Pitot tube readings in sections 1-1, 2-2 and 3-3. 4.6. We find the measured velocity head in each section
where H i - readings of the Pitot tube in the corresponding section; H pi - readings of the piezometric tube in the corresponding section. 4.7. Determine the flow velocity on the axis of the pipe υ = 2gh υ . 4.8. The research results are recorded in table 2. Table 2
Laboratory work on hydraulics - section Education, Ministry of Agriculture of the Russian Federation... Department of Environmental Engineering, construction and hydraulics GPD.F.03 Hydraulics Opd.f.02.05 hydraulics GPD.F.07.01 Hydraulics GPD.F.08.03 HYDRAULICS GPD.F.07 Hydraulics and hydraulic machines GPD.R.03 APPLIED HYDROMECHANICS GPD.F.08 HYDROGAS DYNAMICS Laboratory work in hydraulics GuidelinesUfa 2010Lab #1 MEASUREMENT OF MAIN HYDRAULIC LIQUID CHARACTERISTICS General information In laboratory practice and production conditions, the following parameters are measured: level, pressure and fluid flow. Level measurement. The simplest instrument is a glass tube connected at the lower end to an open reservoir in which the level is determined. In a tube and a tank, as in communicating vessels, the position of the liquid level will be the same. Float level gauges are widely used (in fuel tanks, group automatic drinking bowls, various technological tanks). The working body of the device - the float - follows the measurement of the liquid level, and the readings on the scale change accordingly. The mechanical movement of the float (primary sensor) up and down can be converted into an electrical signal by means of a rheostat or an inductor and recorded by a secondary device. In this case, remote transmission of readings is possible. Of the instruments based on indirect methods for determining the desired value, the capacitive level gauge is of the greatest interest. It uses a metal electrode as a sensor, covered with a thin layer of plastic insulation. The electrode-liquid-reservoir system, when the current is connected, forms a capacitor, the capacitance of which depends on the level of the liquid. The disadvantages of capacitive sensors include a significant dependence of readings on the state of the electrode insulation. Pressure measurement . According to their purpose, devices for measuring atmospheric pressure (barometers), excess pressure (pressure gauges - at p ex > 0 and vacuum gauges - at p ex<0), разности давлений в двух точках (дифференциальные манометры). According to the principle of operation, liquid and spring devices are distinguished. In liquid devices the measured pressure is balanced by a column of liquid, the height of which serves as a measure of pressure. The piezometer is distinguished by its simple design, which is a vertical glass tube connected by its lower end to a place pressure measurements (Fig. 1.1a).
Figure 1.1 Liquid instruments: a) a piezometer; b) U - shaped tube The pressure value at the connection point is determined by the height h of the liquid rise in the piezometer: р=rgh, where r is the density of the liquid. Piezometers are convenient for measuring small overpressures - about 0.1-0.2 at. Functionally, the possibilities are wider for two-pipe U-shaped devices (Fig. 1.1b), which are used as pressure gauges, vacuum gauges and differential pressure gauges. The glass tube of the instrument can be filled with a heavier liquid (such as mercury). Liquid instruments have a relatively high accuracy, they are used for technical measurements, as well as calibration and verification of other types of instruments. In spring devices the measured pressure is perceived by an elastic element (tubular spring, membrane, bellows), the deformation of which serves as a measure of pressure. Widespread devices with tubular springs. In such a device, the lower open end of the oval tube (Fig. 1.2a) is rigidly fixed in the housing, and the upper (closed) end is free in space. Under the action of the pressure of the medium, the tube tends to unbend (if p > p at) or, conversely, bend even more (if p<р ат). В показывающих приборах упругий элемент, перемещаясь, воздействует через передаточный механизм на стрелку и по шкале ведется отсчет измеряемого давления. В приборах с дистанционной передачей показаний механическое перемещение упругого элемента преобразуется в электрический (или пневматический) сигнал, который регистрируется вторичным прибором.
Figure 1.2 Spring devices: a) with a tubular spring; b) bellows; c) membrane According to the accuracy class, devices with tubular single-coil springs are divided into: Technical (for ordinary measurements - accuracy class 1.5; 2.5; 4.0); Exemplary (for accurate measurements - accuracy class 0.16; 0.25; 0.4; 0.6; 1.0); Control (for checking technical priors - accuracy class 0.5 and 1.0). The accuracy class is indicated on the instrument dial; it characterizes the marginal error of the device in % of the maximum value of the scale under normal conditions (t=20°C, p=760 mm Hg). Flow measurement. The simplest and most accurate method for determining fluid flow is volumetric using a measuring vessel. The measurement is reduced to registering the time T of filling a vessel with a known volume W. Then the flow rate is Q=W/T. In production conditions, various volumetric and high-speed meters (vane and turbine) are used as meters for the amount of liquid W. The method allows to determine the time-averaged values of Q. a) b) in)
Figure 2.5 Liquid meters: a− volumetric with oval gears; b− rotational; in− high-speed with a winged turntable To measure instantaneous flow rates in pressure pipelines, various types of flow meters are used (Fig. 1.4). Convenient for measurements flowmeters with narrowing devices. The principle of operation of the device is based on the creation in the flow with the help of a narrowing device (for example, a diaphragm) of a static pressure difference and its measurement with a differential pressure gauge (Fig. 1.4b). The liquid flow rate is determined by the calibration curve Q = f(h) or by the formula: Q = mАÖ2gh, (2.2) where m is the flow coefficient of the narrowing device; h is the reading of the differential pressure gauge; A is the constant of the flow meter;
where D is the diameter of the pipeline; d is the diameter of the opening of the narrowing device.
Figure 1.4 Liquid meters: a) constant differential pressure (rotameter); b) variable pressure drop (with a narrowing device - a diaphragm); c) induction Objective Familiarize yourself with the device, principle of operation and operation of devices for measuring the level, pressure and flow of liquid; learn the method of calibrating flowmeters. Work order1.3.1 Using educational literature, guidelines, posters and full-scale samples of instruments, familiarize yourself with the methods for measuring level, pressure and ... water using a measuring tank. Change Time Control...Lab #2 Experimental study of the equation Bernoulli General information For a steady, smoothly varying motion of a real fluid, the Bernoulli equation has the form: z 1 + where z 1 , z 2 are the heights of the position of the centers of gravity of sections 1 and 2; р 1 , р 2 - pressure in sections; u 1 , u 2 - average flow rates in sections; a 1 ,a 2 - coefficients of kinetic energy. From an energetic point of view: z is the specific potential energy of the position (geometric head); Specific potential energy of pressure (piezometric head); Specific kinetic energy (velocity head). The sum z ++ = H expresses the total specific energy of the fluid (total head). From equation (2.1) it follows that when a real fluid moves, the total head decreases downstream (H 2<Н 1). Величина h 1-2 = Н 1 - Н 2 характеризует потери напора на преодоление гидравлических сопротивлений. A decrease in the total head in a certain way is also reflected in its components - piezometric and velocity pressures. The nature of pressure changes in a particular hydraulic system is of practical interest and can be visually studied empirically. Objective Experimentally confirm the validity of the equation Bernoulli: to establish the nature of the change in total, piezometric and velocity pressures during the movement of fluid in the pipeline under study. Experience methodology Laboratory work can be performed on a specialized installation and a universal stand. In the first case, piezometric and total heads are measured in the control sections of the experimental section with a steady flow of fluid, in the second case, only piezometric ones are measured, with subsequent calculation of the total heads. Based on the experimental data, a head graph is constructed and an analysis is made of the change along the flow of the components of the Bernoulli equation. Description of the pilot plantA schematic diagram of a specialized installation for studying the Bernoulli equation is shown in Figure 2.1. It includes a pressure tank, ... measuring tank. The experimental section is of variable cross section (smooth ... The universal stand (Figure 2.2) has the same design scheme. Its distinguishing feature is an oblique ...Work procedurea) the pressure tank is filled with water to a constant level; b) short-term opening of the valve of the experimental pipeline of the installation ... c) the liquid flow rate is set in the pipeline, ensuring the visibility of observations, and for a given mode ...Processing of experimental dataWhen working on a specialized installation, according to the measurement data, the following is calculated: - average water consumption during the experiment Q = W/T, (2.2)An analysis of the pressure graph is given. A conclusion is given on the nature of the change along the flow of total, piezometric and velocity pressures with appropriate explanations. Test questions 1. What is the physical meaning of the Bernoulli equation? 2. Explain the concepts of geometric, piezometric and total pressure? 4. What do pressure and piezometric lines show? 5. What determines the nature of the change along the flow of total, piezometric and velocity pressures? 6. Due to what energy of a moving fluid are hydraulic resistances overcome? Lab #3 Studying the modes of movement of liquids General information When a fluid moves in a pipeline (channel), two flow regimes are possible: laminar and turbulent. The laminar regime is characterized by layered, ordered motion, in which individual layers of fluid move relative to each other without mixing with each other. A jet of paint introduced into a laminar flow of water is not washed away by the environment and looks like a stretched thread. The turbulent regime is characterized by disordered, chaotic motion, when fluid particles move along complex, constantly changing trajectories. The presence of transverse velocity components in a turbulent flow causes intense mixing of the liquid. In this case, the colored stream cannot exist independently and disintegrates in the form of eddies over the entire cross section of the pipe. Experiments have established that the mode of motion depends on the average speed u, pipe diameter d, fluid density r and its absolute viscosity m. To characterize the regime, it is customary to use a set of these quantities, compiled in a certain way into a dimensionless complex - the Reynolds number where n = m/r is the kinematic viscosity coefficient. The Reynolds number corresponding to the transition from laminar to turbulent flow is called critical and is denoted by Re cr. It should be emphasized that, due to the instability of the fluid flow at the boundary of the laminar and turbulent regimes, the value of Re cr is not strictly defined. For cylindrical pipes during the movement of water, taking into account the conditions of the flow inlet, the roughness of the walls, the presence of initial perturbations Re kr = 580-2000. In calculations, Re kr »2300 is usually taken. At Re In most technical applications associated with the movement of low-viscosity media (water, air, gas, steam), a turbulent regime is implemented - water supply, ventilation, gas supply, heat supply systems. The laminar regime takes place in film heat exchangers (when a condensate film drains under the influence of gravity), when water is filtered in the pores of the soil, when viscous liquids move through pipelines. Objective Visual observations establish the nature of the movement of the fluid under various modes; to master the methodology for calculating the pressure regime; for the pilot plant, determine the critical Reynolds number. Description of the pilot plant The laboratory installation (Figure 3.1) includes a pressure tank, a pipeline (with a transparent section for visual observation), a vessel with a dye, a measuring tank. The vessel with the dye is fixed by means of a tripod on the wall of the pressure tank and is equipped with a tube for supplying the dye to the water flow moving in the pipeline. The flow rate is set by the control valve and is determined using a measuring tank. Work ordera) the pressure tank is filled with water (up to the level of the drain pipe, and the vessel is filled with dye); b) by opening the control valve in the pipeline, the flow rate is set, with ... Observations of the nature of the movement of the liquid are carried out by introducing a dye into the flow.Processing of experimental data- according to the water temperature t (in °С) determine the kinematic coefficient of viscosity ... n = ; (3.2)Analysis of results. Work Conclusions An analysis of visual observations of the nature of fluid motion in various modes is given. The value of the critical Reynolds number for the pilot plant and the results of the calculated determination of the regime are noted. test questions 1. What fluid flow regimes do you know? 2. Explain the method of experimental determination of the flow regime. 3. What is the fundamental difference between a turbulent regime and a laminar one? 4. How is the flow regime determined by calculation? 5. Define the critical Reynolds number. 6. Give examples of technical systems (devices) in which: a) laminar flow; b) turbulent regime. Lab #4 Determination of the coefficient of hydraulic Friction General information A fluid flow uniformly moving in a pipe (channel) loses part of its energy due to friction on the pipe surface, as well as internal friction in the fluid itself. These losses are called head loss along the length of the flow or friction head loss. In accordance with the Bernoulli equation, the head loss along the length of a horizontal pipe of constant diameter h dl = , (4.1) where are the piezometric heads in the sections under consideration. Experiments show that the pressure loss along the length is proportional to the dimensionless coefficient l, depends on the length l and diameter d of the pipeline, the average speed u. This dependence is established by the well-known Darcy-Weisbach formula h dl = . (4.2) The coefficient l characterizing the friction resistance generally depends on the Reynolds number Re and the relative roughness of the pipe walls D/d (here D is the absolute size of the roughness projections). However, the effect of these quantities on the coefficient l in laminar and turbulent regimes is different. In the laminar regime, the roughness does not affect the friction resistance. In this case, l = f(Re) and the calculation is performed according to the formula l = 64/Re. (4.3) In the turbulent regime, the influence of Re and D/d is determined by the value of the Reynolds number. For relatively small Re, as well as for the laminar regime, the coefficient l is a function of only the Reynolds number Re (the region of hydraulically smooth pipes). For the calculation here, the formulas of G. Blasius are applicable for Re £ 10 5: l = 0.316/Re 0.25 , (4.4) and formula g.K. Konakov at Re £ 3 × 10 6: In the range of moderate Reynolds numbers l = f(Re,) and good agreement with experiment is given by the formula of A.D. Altshulya: For sufficiently large values of Re (developed turbulent flow), the effect of viscous friction is insignificant and the coefficient l = f(D/d) is the so-called region of completely rough pipes. In this case, the calculation can be performed according to the formula of B.L. Shifrinson: The above and other well-known empirical formulas for determining the coefficient of hydraulic friction are obtained by processing the experimental graphs. Comparing the results of calculating l using these formulas with experimental values, one can evaluate the reliability of the experiments. Objective To master the method of experimental determination of the coefficient of hydraulic friction; for the conditions of the experiment, establish the dependence of the coefficient of hydraulic friction on the fluid flow regime and compare the results obtained with calculations using empirical formulas. Experience methodology The coefficient of hydraulic friction is determined indirectly using the Darcy-Weisbach formula (4.2). At the same time, directly from experience, the head loss h dl is found from the difference in piezometric heads at the beginning and end of the investigated section of the pipeline, and the speed of movement u from the fluid flow rate Q. The dependence l = f(Re) is established by carrying out experiments for various modes of fluid motion and constructing an appropriate graph. Description of the pilot plant The laboratory setup (Figure 4.1) includes a pressure tank, an experimental pipeline and a measuring tank. Experimental pipeline - horizontal, constant section (l = 1.2 m, d = 25 mm). There are two static pressure nipples in the section for determining pressure losses, which are connected to piezometers with the help of rubber hoses. A valve for regulating the water flow is mounted behind the measuring section. Work procedurea) the pressure tank is filled with water to a constant level; b) by opening the valve for a short time, the installation is put into action for ... c) in the pipeline, various flow rates of the liquid are set in the range from minimum to maximum (only 5-6 ...Processing of experimental data4.6.1 According to the measurement data, calculate: - flow rate Q, average speed u, kinematic viscosity coefficient n, Reynolds number Re (see laboratory work ...Analysis of results. Conclusion on worktest questionsLab #5 Determination of the coefficient of local resistance General information In real hydraulic systems, a moving fluid loses mechanical energy in straight sections of pipes, as well as in fittings and fittings, and other local resistances. Energy losses to overcome local resistances (the so-called local pressure losses) are partly due to friction, but to a greater extent, the deformation of the flow, its separation from the walls, and the occurrence of intense vortex flows. Local pressure losses are determined by calculation according to the Weisbach formula: h m = z m (u 2 /2g), (5.1) where z m is the coefficient of local resistance; showing how much of the velocity head is spent to overcome the resistance. The value of z m in the general case depends on the type of local resistance and the flow regime. The experimental values of the coefficient for the quadratic region of the turbulent regime are given in the reference tables. Objective To master the method of experimental determination of the coefficient of local resistance; determine empirically the coefficient z m for the investigated local resistance, establish its dependence on the Reynolds number and compare the data obtained with the tabular ones. Experience methodologyThe coefficient of local resistance is determined by an indirect method using dependence (5.1). At the same time, local head losses hm are found from ...Description of the pilot plant The installation for the experimental determination of the coefficient of local resistance (Figure 5.1) includes a pressure tank, a pipeline with the investigated local resistance and a measuring tank. Static pressure nipples are installed on the pipeline in front of the local resistance and behind it, which are connected to piezometers with the help of rubber hoses. There is a valve to control the flow of water. Work procedurea) the pressure tank is filled with water to a constant level; b) check the absence of air in the piezometers (water levels in them when closed ... c) in the pipeline, set various water flow rates in the range from minimum to maximum (only 5-6 ...Processing of experimental dataAccording to the measurement data, the following is calculated: - average flow rate Q = W / T and average flow rate u = Q / w (where w is the cross-sectional area ...Analysis of resultstest questionsWhat will we do with the received material:If this material turned out to be useful to you, you can save it to your page on social networks: Read also:
| |||||||||||||||||||||||||||||||||||||||||||||||||||||||||||||||||||||||||||||||||||||||||||||||||||||||||||||||||||||||||||||||||||||||||||||||||||||||||||||||||||||||||||||||||||||||||||||||||||||||||||||||||||||||||||||||||||||||||||||||||||||||||||||||||||||||||||||||||||||||||||||||||||||||||||||||||||||||||||||||||||||||||||||||||||||||||||