Andrey Lipov
If we talk in simple language, then the standard deviation shows how much the price of an instrument fluctuates over time. That is, the higher this indicator, the greater the volatility or variability of a number of values.
Standard deviation can and should be used to analyze sets of values, since two sets with seemingly the same average may turn out to be completely different in the spread of values.
Example
Let's take two rows of numbers.
a) 1,2,3,4,5,6,7,8,9. Average - 5. St. deviation = 2.7386
b) 20,1,7,1,15,-1,-20,4,18,5. Average - 5. St. deviation = 12.2066
If you do not keep the entire series of numbers in front of your eyes, then the standard deviation indicator shows that in case “b” the values are much more scattered around their average value.
Roughly speaking, in series “b” the value is 5 plus or minus 12 (on average) - not exact, but it reveals the meaning.
How to calculate standard deviation
To calculate the standard deviation, you can use a formula borrowed from calculating the standard deviation of mutual fund returns:
Here N is the number of quantities,
DOHaverage - the average of all values,
DOH period - value N.
In Excel, the corresponding function is called STANDARDEVIL (or STDEV in English version programs).
The step-by-step instructions are as follows:
- Calculate the average for a series of numbers.
- For each value, determine the difference between the mean and that value.
- Calculate the sum of the squares of these differences.
- Divide the resulting sum by the number of numbers in the series.
- Take Square root from the number obtained in the last paragraph.
Your friends will find this information useful. Share with them!
DEFINITION OF THE POPULATION AND
PARAMETERS BASED ON SAMPLE STATISTICS;
AVERAGE AND STANDARD DEVIATION
Determining the population mean
(general population)
The reaction time experiment described in the Appendix to Chapter 1 was based on the results of an actual experiment. They were intended to represent data that could be obtained in an experiment with full internal validity. Thus, the average reaction time to a light signal over 17 trials represented the average that could be obtained in an experiment with an unlimited number of trials.
We use the average of a limited sample sample to infer a sufficiently large (up to an unlimited) sample population. This population is called the general population. The population average of data such as BP is denoted M x. This characteristic of the population is called a parameter. The average that we actually calculated for a given sample is called statistics, and is denoted M x. Is the M x statistic the best estimate of the M x parameter that we can obtain from our sample sample? The answer is - without proof - yes. But before you decide that this is always the case, let's move on to standard deviation, where things are different.
Calculating standard deviation
Usually, in addition to the mean of the scores, we want to know something else, namely, what is the non-systematic variation of the scores from trial to trial. The most common way to measure unsystematic variation is to calculate the standard deviation.
To do this, you determine how much each estimate (i.e. X) more or less than average ( M X). Then you square each difference ( X-M X) and add them up. Following this, you divide this amount by N number of samples Finally, you take the square root of this average.
This calculation is represented by a formula using the symbol σ x to denote standard deviation:
90This formula can be shortened by introducing a small x to represent ( X-M X). Then the formula looks like this:
 (2.1A)
Let's write out the data for condition A from the appendix to Chapter I and at the same time carry out the calculations indicated by the formula for σ x
|
Try |
M X |
X - M X |
x 2 |
|
|
orX |
||||
|
Σ x 2 |
Because the

 ms.
ms.
91Standard Deviation Estimation
population
To determine the population mean that would be obtained in an infinite experiment, the best estimate was actually the sample mean. The situation is different with standard deviation. In any set of real samples there are fewer results with very high or very low values than in the population. And since the standard deviation is a measure of the dispersion of estimates, its value determined on the basis of a sample is always less than the population parameter sigma σ x.
A more accurate estimate of the standard deviation for the population can be found using the formula
 (2.2)
(2.2)
 (2.2A)
For our numerical data:
 ms.
ms.
Some experiments hypothesize that behavior in one condition is more variable than in another. Then it makes more sense to compare standard deviations rather than averages. If for both conditions N the same thing, you can compare sigmas with each other. However, when N different, sigma for the condition with less N gives a more underestimated estimate of such a population parameter as the standard deviation. Therefore, you should compare the two S.
The table below will help you remember these provisions and formulas.92
|
Average |
Standard deviation |
|||
|
Parametric characteristics of the general population (g.s.) |
|
|
||
|
Statistical characteristics of the sample |
|
|
||
|
Population parameter to be estimated |
|
|
|
|


Task: Calculate σ x and S x for condition B.
Answer:σ B = 15.9; σ B = 16.4.
In order to find the average value in Excel (no matter whether it is a numeric, text, percentage or other value), there are many functions. And each of them has its own characteristics and advantages. Indeed, in this task certain conditions may be set.
For example, the average values of a series of numbers in Excel are calculated using statistical functions. You can also manually enter your own formula. Let's consider various options.
How to find the arithmetic mean of numbers?
To find the arithmetic mean, you need to add up all the numbers in the set and divide the sum by the quantity. For example, a student’s grades in computer science: 3, 4, 3, 5, 5. What is included in the quarter: 4. We found the arithmetic mean using the formula: =(3+4+3+5+5)/5.
How to quickly do this using Excel functions? Let's take for example a series of random numbers in a string:

Or: make the active cell and simply enter the formula manually: =AVERAGE(A1:A8).
Now let's see what else the AVERAGE function can do.

Let's find the arithmetic mean of the first two and three last numbers. Formula: =AVERAGE(A1:B1,F1:H1). Result:
Condition average
The condition for finding the arithmetic mean can be a numerical criterion or a text one. We will use the function: =AVERAGEIF().
Find the average arithmetic numbers, which are greater than or equal to 10.
Function: =AVERAGEIF(A1:A8,">=10")
 The result of using the AVERAGEIF function under the condition ">=10":
 The third argument – “Averaging range” – is omitted. First of all, it is not required. Secondly, the range analyzed by the program contains ONLY numeric values. The cells specified in the first argument will be searched according to the condition specified in the second argument.
Attention! The search criterion can be specified in the cell. And make a link to it in the formula.
Let's find the average value of the numbers using the text criterion. For example, the average sales of the product “tables”.

The function will look like this: =AVERAGEIF($A$2:$A$12,A7,$B$2:$B$12). Range – a column with product names. The search criterion is a link to a cell with the word “tables” (you can insert the word “tables” instead of link A7). Averaging range – those cells from which data will be taken to calculate the average value.
As a result of calculating the function, we obtain the following value:
Attention! For a text criterion (condition), the averaging range must be specified.
How to calculate the weighted average price in Excel?

How did we find out the weighted average price?
Formula: =SUMPRODUCT(C2:C12,B2:B12)/SUM(C2:C12).

Using the SUMPRODUCT formula, we find out the total revenue after selling the entire quantity of goods. And the SUM function sums up the quantity of goods. By dividing the total revenue from the sale of goods by the total number of units of goods, we found the weighted average price. This indicator takes into account the “weight” of each price. Its share in the total mass of values.
Standard deviation: formula in Excel
There are standard deviations for the general population and for the sample. In the first case, this is the root of the general variance. In the second, from the sample variance.
To calculate this statistical indicator, a dispersion formula is compiled. The root is extracted from it. But in Excel there is a ready-made function for finding the standard deviation.

The standard deviation is tied to the scale of the source data. For figurative representation this is not enough about the variation of the analyzed range. To obtain the relative level of data scatter, the coefficient of variation is calculated:
standard deviation / arithmetic mean
The formula in Excel looks like this:
STDEV (range of values) / AVERAGE (range of values).
The coefficient of variation is calculated as a percentage. Therefore, we set the percentage format in the cell.
The STDEV.B function returns the standard deviation calculated over a specified range of numeric values.
The STDEV.G function is used to determine the standard deviation of a population of numeric values and returns the value of the standard deviation, assuming that the values passed are the entire population and not a sample.
The STANDARDEV function returns the standard deviation value for a certain range of numbers, which is a sample and not the entire population.
The STD function returns the standard deviation of the entire population passed as its arguments.
Examples of using STDEV.V, STDEV.G, STDEV and STDEV
Example 1. An enterprise employs two customer acquisition managers. Data on the number of clients served per day by each manager is recorded in an Excel table. Determine which of the two employees works more efficiently.
Source data table:
First, let’s calculate the average number of clients with whom managers worked daily:
AVERAGE(B2:B11)
This function calculates the arithmetic average for the range B2:B11, which contains data on the number of clients accepted daily by the first manager. Similarly, we calculate the average number of clients per day for the second manager. We get:

Based on the obtained values, it seems that both managers are working approximately equally efficiently. However, a strong dispersion in the number of clients for the first manager is visually visible. Let's calculate the standard deviation using the formula:

STDEV.B(B2:B11)
B2:B11 – range of studied values. Similarly, we determine the standard deviation for the second manager and obtain the following results:

As you can see, the performance indicators of the first manager are characterized by high variability (scatter) of values, and therefore the arithmetic average absolutely does not reflect the real picture of performance. A deviation of 1.2 indicates more stable, and, therefore, effective work of the second manager.
Example of using the STANDARDEV function in Excel
Example 2. Two different groups of college students were given an exam in the same discipline. Assess student performance.
Source data table:

Let's determine the standard deviation of values for the first group using the formula:

STDEV(A2:A11)
We will make a similar calculation for the second group. As a result we get:

The obtained values indicate that the students of the second group were much better prepared for the exam, since the spread of grades is relatively small. Note that the STANDARDEV function converts text value"failed" in numeric value 0 (zero) and takes it into account in calculations.
Example of the STANDARDEV.G function in Excel
Example 3. Determine the effectiveness of preparing students for the exam for all groups of the university.
Note: unlike the previous example, not a sample (several groups) will be analyzed, but the entire number of students - the general population. Students who do not pass the exam are not taken into account.
Let's fill out the data table:

To assess effectiveness, we will operate with two indicators: the average score and the spread of values. To determine the arithmetic mean we use the function:
AVERAGE(B2:B21)
To determine the deviation, we introduce the formula:

STDEV.G(B2:B21)
As a result we get:

The data obtained indicates academic performance slightly below average (<4), величина разброса характеризует довольно большое количество студентов, получивших 5 и 3 соответственно (учитывая, что анализировались только данные из диапазона от 3 до 5).
Example of the standard deviation function in Excel
Example 4. Analyze the performance of students based on the exam results, taking into account those students who failed to pass this exam.
Data table:

In this example, we are also analyzing the population, but some data fields contain text values. To determine the standard deviation we use the function:

STDEV(B2:B21)
As a result we get:

A high spread of values in the sequence indicates a large number of students who failed the exam.
Features of using STDEV.V, STDEV.G, STDEV and STDEV
The STDEV and STDEV functions have identical syntax like:
FUNCTION (value1; [value2];…)
Description:
- FUNCTION – one of the two functions discussed above;
- value1 – a required argument characterizing one of the values of the sample (or the general population);
- [value2] – an optional argument characterizing the second value of the range under study.
Notes:
- Function arguments can include names, numeric values, arrays, references to ranges of numeric data, Boolean values, and references to them.
- Both functions ignore empty values and text data contained in the passed data range.
- The functions return the error code #VALUE! if error values or text data that cannot be converted to numeric values were passed as arguments.
The functions STDEV.V and STDEV.G have the following syntax:
FUNCTION(number1;[number2];…)
Description:
- FUNCTION – any of the functions STANDARDDEVIATION.V or STANDARDDEVIATION.G;
- number1 – a required argument characterizing a numerical value taken from a sample or the entire population;
- number2 – an optional argument characterizing the second numeric value of the range under study.
Note: Both functions do not include numbers represented as text data, or the Boolean values TRUE and FALSE, in the calculation process.
Notes:
- Standard deviation is widely used in statistical calculations when finding the average of a range of values does not provide a true representation of the distribution of the data. It demonstrates the principle of distribution of values relative to the average value in a specific sample or the entire sequence. Example 1 will clearly examine the practical application of this statistical parameter.
- The functions STANDARDEVAL and STANDDREVAL.B should be used to analyze only part of the population and calculate using the first formula, while STANDARDEV.G and STANDARDEVAL should take input data about the entire population and calculate using the second formula.
- Excel contains built-in functions STDEV and STDEV that are retained for compatibility with older versions of Microsoft Office. They may not be included in later versions of the program, so their use is not recommended.
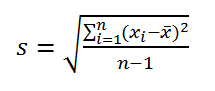
- To find the standard deviation, two common formulas are used: S=√((∑_(i=1)^n▒(x_i-x_av)^2)/(n-1)) and S=√((∑_(i= 1)^n▒(x_i-x_ср)^2)/n), where:
- S – the desired value of the standard deviation;
- n – considered range of values (sample);
- x_i – individual value from the sample;
- x_avg – arithmetic mean value for the considered range.
Let's calculate inMSEXCELsample variance and standard deviation. We will also calculate the variance of a random variable if its distribution is known.
Let's first consider dispersion, then standard deviation.
Sample variance
Sample variance (sample variance,samplevariance) characterizes the spread of values in the array relative to .
All 3 formulas are mathematically equivalent.
From the first formula it is clear that sample variance is the sum of the squared deviations of each value in the array from average, divided by sample size minus 1.
variances samples the DISP() function is used, English. the name VAR, i.e. VARiance. From version MS EXCEL 2010, it is recommended to use its analogue DISP.V(), English. the name VARS, i.e. Sample VARiance. In addition, starting from the version of MS EXCEL 2010, there is a function DISP.Г(), English. name VARP, i.e. Population VARiance, which calculates dispersion For population. The whole difference comes down to the denominator: instead of n-1 like DISP.V(), DISP.G() has just n in the denominator. Before MS EXCEL 2010, the VAR() function was used to calculate the variance of the population.
Sample variance
=QUADROTCL(Sample)/(COUNT(Sample)-1)
=(SUM(Sample)-COUNT(Sample)*AVERAGE(Sample)^2)/ (COUNT(Sample)-1)– usual formula
=SUM((Sample -AVERAGE(Sample))^2)/ (COUNT(Sample)-1) –
Sample variance is equal to 0, only if all values are equal to each other and, accordingly, equal average value. Usually, the larger the value variances, the greater the spread of values in the array.
Sample variance is a point estimate variances distribution of the random variable from which it was made sample. About construction confidence intervals when assessing variances can be read in the article.
Variance of a random variable
To calculate dispersion random variable, you need to know it.
For variances random variable X is often denoted Var(X). Dispersion equal to the square of the deviation from the mean E(X): Var(X)=E[(X-E(X)) 2 ]
dispersion calculated by the formula:

where x i is the value that a random variable can take, and μ is the average value (), p(x) is the probability that the random variable will take the value x.
If a random variable has , then dispersion calculated by the formula:

Dimension variances corresponds to the square of the unit of measurement of the original values. For example, if the values in the sample represent part weight measurements (in kg), then the variance dimension would be kg 2 . This can be difficult to interpret, so to characterize the spread of values, a value equal to the square root of variances – standard deviation.
Some properties variances:
Var(X+a)=Var(X), where X is a random variable and a is a constant.
Var(aХ)=a 2 Var(X)
Var(X)=E[(X-E(X)) 2 ]=E=E(X 2)-E(2*X*E(X))+(E(X)) 2 =E(X 2)- 2*E(X)*E(X)+(E(X)) 2 =E(X 2)-(E(X)) 2
This dispersion property is used in article about linear regression.
Var(X+Y)=Var(X) + Var(Y) + 2*Cov(X;Y), where X and Y are random variables, Cov(X;Y) is the covariance of these random variables.
If random variables are independent, then they covariance is equal to 0, and therefore Var(X+Y)=Var(X)+Var(Y). This property of dispersion is used in derivation.
Let us show that for independent quantities Var(X-Y)=Var(X+Y). Indeed, Var(X-Y)= Var(X-Y)= Var(X+(-Y))= Var(X)+Var(-Y)= Var(X)+Var(-Y)= Var( X)+(-1) 2 Var(Y)= Var(X)+Var(Y)= Var(X+Y). This dispersion property is used to construct .
Sample standard deviation
Sample standard deviation is a measure of how widely scattered the values in a sample are relative to their .
A-priory, standard deviation equal to the square root of variances:
Standard deviation does not take into account the magnitude of the values in sample, but only the degree of dispersion of values around them average. To illustrate this, let's give an example.
Let's calculate the standard deviation for 2 samples: (1; 5; 9) and (1001; 1005; 1009). In both cases, s=4. It is obvious that the ratio of the standard deviation to the array values differs significantly between samples. For such cases it is used The coefficient of variation(Coefficient of Variation, CV) - ratio Standard Deviation to the average arithmetic, expressed as a percentage.
In MS EXCEL 2007 and earlier versions for calculation Sample standard deviation the function =STDEVAL() is used, English. name STDEV, i.e. STandard DEViation. From the version of MS EXCEL 2010, it is recommended to use its analogue =STDEV.B() , English. name STDEV.S, i.e. Sample STandard DEViation.
In addition, starting from the version of MS EXCEL 2010, there is a function STANDARDEV.G(), English. name STDEV.P, i.e. Population STandard DEViation, which calculates standard deviation For population. The whole difference comes down to the denominator: instead of n-1 as in STANDARDEV.V(), STANDARDEVAL.G() has just n in the denominator.
Standard deviation can also be calculated directly using the formulas below (see example file)
=ROOT(QUADROTCL(Sample)/(COUNT(Sample)-1))
=ROOT((SUM(Sample)-COUNT(Sample)*AVERAGE(Sample)^2)/(COUNT(Sample)-1))
Other measures of scatter
The SQUADROTCL() function calculates with a sum of squared deviations of values from their average. This function will return the same result as the formula =DISP.G( Sample)*CHECK( Sample) , Where Sample- a reference to a range containing an array of sample values (). Calculations in the QUADROCL() function are made according to the formula:

The SROTCL() function is also a measure of the spread of a data set. The function SROTCL() calculates the average of the absolute values of deviations of values from average. This function will return the same result as the formula =SUMPRODUCT(ABS(Sample-AVERAGE(Sample)))/COUNT(Sample), Where Sample- a link to a range containing an array of sample values.
Calculations in the function SROTCL () are made according to the formula: