Important!
A function of the form “y = kx + b” is called a linear function.
The letter factors "k" and "b" are called numerical coefficients.
Instead of “k” and “b” there can be any numbers (positive, negative or fractions).
In other words, we can say that “y = kx + b” is a family of all possible functions, where instead of “k” and “b” there are numbers.
Examples of functions like “y = kx + b”.
- y = 5x + 3
- y = −x + 1
- y = x − 2
k = 2 3 b = −2 y = 0.5x k = 0.5 b = 0 Pay special attention to the "y = 0.5x" function in the table. They often make the mistake of looking for the numerical coefficient “b”.
When considering the function “y = 0.5x”, it is incorrect to say that there is no numerical coefficient “b” in the function.
The numerical coefficient "b" is always present in a function like "y = kx + b" always. In the function “y = 0.5x” the numerical coefficient “b” is zero.
How to graph a linear function
"y = kx + b"Remember!
The graph of the linear function “y = kx + b” is a straight line.
Since the graph of the function “y = kx + b” is a straight line, the function is called linear function.
From geometry, let us recall the axiom (a statement that does not require proof) that through any two points you can draw a straight line and, moreover, only one.
Based on the axiom above, it follows that in order to plot a function of the form
“y = kx + b” it will be enough for us to find only two points.For example let's build a graph of the function"y = −2x + 1".
Let's find the value of the function "y" for two arbitrary values "x". Let us substitute, for example, instead of “x” the numbers “0” and “1”.
Important!
When choosing arbitrary numeric values instead of “x”, it is better to take the numbers “0” and “1”. It's easy to do calculations with these numbers.
The resulting values “x” and “y” are the coordinates of the points on the function graph.
Let's write the obtained coordinates of the points “y = −2x + 1” into the table.
Let us mark the obtained points on the coordinate system.

Now let's draw a straight line through the marked points. This line will be the graph of the function “y = −2x + 1”.

How to solve problems on
linear function “y = kx + b”Let's consider the problem.
Graph the function “y = 2x + 3”. Find by graph:
- the value “y” corresponding to the value “x” equal to −1; 2; 3; 5 ;
- the value of "x" if the value of "y" is 1; 4; 0; −1.
First, let's plot the function “y = 2x + 3”.
We use the rules by which we are superior. To graph the function “y = 2x + 3” it is enough to find only two points.
Let's choose two arbitrary numeric values for “x”. For convenience of calculations, we will choose the numbers “0” and “1”.
Let's carry out the calculations and write their results in the table.
Let us mark the obtained points on the rectangular coordinate system.

Let's connect the resulting points with a straight line. The drawn straight line will be a graph of the function “y = 2x + 3”.

Now we work with the constructed graph of the function “y = 2x + 3”.
You need to find the value “y” corresponding to the value “x”,
which is equal to −1; 2; 3; 5 .- Ox" to zero (x = 0) ;
- substitute zero for “x” in the function formula and find the value “y”;
- Oy".
Instead of “x” in the formula of the function “y = −1.5x + 3”, let’s substitute the number zero.
Y(0) = −1.5 0 + 3 = 3
(0; 3) - coordinates of the point of intersection of the graph of the function “y = −1.5x + 3” with the axis “Oy”.Remember!
To find the coordinates of the intersection point of the graph of a function
with axis " Ox"(x axis) you need:- equate the coordinate of a point along the "" axis Oy" to zero (y = 0) ;
- substitute zero instead of “y” in the function formula and find the value of “x”;
- write down the obtained coordinates of the point of intersection with the axis " Oy".
Instead of “y” in the formula of the function “y = −1.5x + 3”, let’s substitute the number zero.
0 = −1.5x + 3
1.5x = 3 | :(1.5)
x = 3: 1.5
x = 2
(2; 0) - coordinates of the point of intersection of the graph of the function “y = −1.5x + 3” with the “Ox” axis.To make it easier to remember which coordinate of a point should be equated to zero, remember the “rule of opposites.”
Important!
If you need to find the coordinates of the point of intersection of the graph with the axis " Ox", then we equate “y” to zero.
And vice versa. If you need to find the coordinates of the point of intersection of the graph with the "" axis Oy", then we equate “x” to zero.
Learn to take derivatives of functions. The derivative characterizes the rate of change of a function at a certain point lying on the graph of this function. In this case, the graph can be either a straight or curved line. That is, the derivative characterizes the rate of change of a function at a specific point in time. Remember the general rules by which derivatives are taken, and only then proceed to the next step.
- Read the article.
- How to take the simplest derivatives, for example, the derivative of an exponential equation, is described. The calculations presented in the following steps will be based on the methods described therein.
Learn to distinguish problems in which the slope coefficient needs to be calculated through the derivative of a function. Problems do not always ask you to find the slope or derivative of a function. For example, you may be asked to find the rate of change of a function at point A(x,y). You may also be asked to find the slope of the tangent at point A(x,y). In both cases it is necessary to take the derivative of the function.
Take the derivative of the function given to you. There is no need to build a graph here - you only need the equation of the function. In our example, take the derivative of the function f (x) = 2 x 2 + 6 x (\displaystyle f(x)=2x^(2)+6x). Take the derivative according to the methods outlined in the article mentioned above:
Substitute the coordinates of the point given to you into the found derivative to calculate the slope. The derivative of a function is equal to the slope at a certain point. In other words, f"(x) is the slope of the function at any point (x,f(x)). In our example:
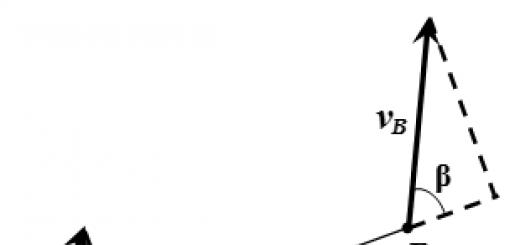
If possible, check your answer on a graph. Remember that the slope cannot be calculated at every point. Differential calculus deals with complex functions and complex graphs where the slope cannot be calculated at every point, and in some cases the points do not lie on the graphs at all. If possible, use a graphing calculator to check that the slope of the function you are given is correct. Otherwise, draw a tangent to the graph at the point given to you and think about whether the slope value you found matches what you see on the graph.
- The tangent will have the same slope as the graph of the function at a certain point. To draw a tangent at a given point, move left/right on the X axis (in our example, 22 values to the right), and then up one on the Y axis. Mark the point, and then connect it to the point given to you. In our example, connect the points with coordinates (4,2) and (26,3).
Consider the function y=k/y. The graph of this function is a line, called a hyperbola in mathematics. The general view of a hyperbola is shown in the figure below. (The graph shows the function y equals k divided by x, for which k equals one.)
It can be seen that the graph consists of two parts. These parts are called branches of the hyperbola. It is also worth noting that each branch of the hyperbola approaches in one of the directions closer and closer to the coordinate axes. The coordinate axes in this case are called asymptotes.
In general, any straight lines to which the graph of a function infinitely approaches but does not reach them are called asymptotes. A hyperbola, like a parabola, has axes of symmetry. For the hyperbola shown in the figure above, this is the line y=x.
Now let's look at two common cases of hyperbole. The graph of the function y = k/x, for k ≠0, will be a hyperbola, the branches of which are located either in the first and third coordinate angles, for k>0, or in the second and fourth coordinate angles, for k<0.
Basic properties of the function y = k/x, for k>0

Graph of the function y = k/x, for k>0
5. y>0 at x>0; y6. The function decreases both on the interval (-∞;0) and on the interval (0;+∞).
10. The range of values of the function is two open intervals (-∞;0) and (0;+∞).
Basic properties of the function y = k/x, for k<0

Graph of the function y = k/x, at k<0
1. Point (0;0) is the center of symmetry of the hyperbola.
2. Coordinate axes - asymptotes of the hyperbola.
4. The domain of definition of the function is all x except x=0.
5. y>0 at x0.
6. The function increases both on the interval (-∞;0) and on the interval (0;+∞).
7. The function is not limited either from below or from above.
8. A function has neither a maximum nor a minimum value.
9. The function is continuous on the interval (-∞;0) and on the interval (0;+∞). Has a gap at x=0.
In 7th grade we studied the functions y = C, y = kx, y = kx + m, y = x 2 and eventually came to the conclusion that an equation with two variables of the form y = f(x) (function) is a mathematical model convenient for, having given a specific value of the independent variable x (argument), to calculate the corresponding
the corresponding value of the dependent variable y. For example, if the function y = x 2 is given, i.e. f(x) = x 2, then for x = 1 we get y = 1 2 = 1; In short, it is written like this: f(1) = 1. For x = 2 we get f(2) = 2 2 = 4, i.e. y = 4; for x = - 3 we get f(- 3) = (- 3) 2 = 9, i.e. y = 9, etc.
Already in the 7th grade, you and I began to understand that in the equality y = f(x) the right side, i.e. the expression f(x) is not limited to the four cases listed above (C, kx, kx + m, x 2).
For example, we have already encountered piecewise functions, i.e. functions defined by different formulas on different intervals. Here is one such function:
y = f(x), where
Do you remember how to graph such functions? First you need to construct a parabola y = x 2 and take its part at x< 0 (левая ветвь параболы, рис. 1), затем надо построить прямую у = 2х и взять ее часть при х >0 (Fig. 2). And finally, both selected parts must be combined in one drawing, i.e., built on the same coordinate plane (see Fig. 3).

Now our task is the following: to replenish the stock of studied functions. In real life, there are processes described by various mathematical models of the form y = f(x), not only those that we listed above. In this section we will consider the function y = kx 2, where the coefficient k is any non-zero number.

In fact, the function y = kx 2 in one case is a little familiar to you. Look: if k = 1, then we get y = x 2; You studied this function in 7th grade and probably remember that its graph is a parabola (Fig. 1). Let's discuss what happens at other values of the coefficient k.
Consider two functions: y = 2x 2 and y = 0.5x 2. Let's make a table of values for the first function y = 2x 2:
Let's construct the points (0; 0), (1; 2), (-1; 2), (2; 8), (-2; 8), (1.5; 4.5), (-1.5; 4,5) on the coordinate plane (Fig. 4); they outline a certain line, let's draw it
(Fig. 5).
Let's make a table of values for the second function y = 0.5x 2:
Let's construct points (0; 0), (1; 0.5), (-1; 0.5), (2; 2), (-2; 2), C; 4.5), (-3; 4.5) on the coordinate plane (Fig. 6); they outline a certain line, let’s draw it (Fig. 7)
 .
.
The points shown in Fig. 4 and 6 are sometimes called control points for the graph of the corresponding function.
Compare Figures 1, 5 and 7. Isn’t it true that the lines drawn are similar? Each of them is called a parabola; in this case, the point (0; 0) is called the vertex of the parabola, and the y-axis is the axis of symmetry of the parabola. The “speed of upward movement” of the branches of the parabola depends on the value of the coefficient k, or, as they also say,
"degree of steepness" of a parabola. This is clearly visible in Fig. 8, where all three parabolas constructed above are located on the same coordinate plane.
The situation is exactly the same with any other function of the form y = kx 2, where k > 0. Its graph is a parabola with the vertex at the origin, the branches of the parabola are directed upward, and the steeper the higher the coefficient k. The y-axis is the axis of symmetry of the parabola. By the way, for the sake of brevity, mathematicians often say “parabola y = kx 2” instead of the long phrase “parabola serving as a graph of the function y = kx 2”, and instead of the term “axis of symmetry of a parabola” they use the term “parabola axis”.
Do you notice that there is an analogy with the function y = kx? If k > 0, then the graph of the function y = kx is a straight line passing through the origin of coordinates (remember, we said briefly: straight line y = kx), and here, too, the “degree of steepness” of the straight line depends on the value of the coefficient k. This is clearly visible on
rice. 9, where graphs of linear functions y = kx are shown in one coordinate system for three values of the coefficient

Let's return to the function y = kx 2. Let us find out how things stand in the case of a negative coefficient ft. Let's build, for example, a graph of the function
y = - x 2 (here k = - 1). Let's create a table of values:
Mark the points (0; 0), (1; -1), (-1; -1), (2; -4), (-2; -4), (3; -9), (- 3; - 9) on the coordinate plane (Fig. 10); they outline a certain line, let’s draw it (Fig. 11). This is a parabola with a vertex at the point (0; 0), the y-axis is the axis of symmetry, but unlike the case when k > 0, this time the branches of the parabola are directed downward. The situation is similar for other negative values of the coefficient k.

So, the graph of a function is a parabola with its vertex at the origin; the y-axis is the axis of the parabola; the branches of the parabola are directed upward at k>0 u downward at k<0.
Let us also note that the parabola y = kx 2 touches the x axis at the point (0; 0), that is, one branch of the parabola smoothly passes into the other, as if pressing against the x axis.
If you plot graphs of the functions y = x2 and y = - x2 in the same coordinate system, then it is easy to notice that these parabolas are symmetrical to each other relative to the x axis, which is clearly visible in Fig. 12. In the same way, the parabolas y = 2x 2 and y = - 2x 2 are symmetrical to each other relative to the x axis (don’t be lazy, build these
two parabolas in the same coordinate system and make sure the statement is true).
In general, the graph of the function y = - f(x) is symmetrical to the graph of the function y = f(x) relative to the abscissa.
Properties of the function y = kx 2 for k > 0
Describing the properties of this function, we will rely on its geometric model - a parabola (Fig. 13).
1. Since for any value of x the corresponding value of y can be calculated using the formula y = kx 2, the function is defined at any point x (for any value of the argument x). In short, it is written like this: the domain of definition of the function is (-oo, +oo), i.e. the entire coordinate line.

2. y = 0 at x = 0; y > O at . This can also be seen from the graph of the function (it is entirely located above the x-axis), but can be justified without the help of a graph: if
Then kx 2 > O as the product of two positive numbers k and x 2 .
3. y = kx 2 is a continuous function. Let us recall that for now we consider this term as a synonym for the sentence “the graph of a function is a solid line that can be drawn without lifting the pencil from the paper.” In higher grades, a more precise mathematical interpretation of the concept of continuity of a function will be given, not relying on geometric illustration.
4.y/ naim = 0 (achieved at x = 0); nai6 does not exist.
Recall that (/max is the smallest value of the function, and Unaib. is the largest value of the function on a given interval; if the interval is not specified, then unaim- and y max. are, respectively, the smallest and largest values of the function in the domain of definition.
5. The function y = kx 2 increases as x > O and decreases as x< 0.
Let us recall that in the 7th grade algebra course we agreed to call a function whose graph on the interval under consideration goes from left to right as if “uphill”, increasing, and a function whose graph on the interval under consideration goes from left to right as if “downhill”, - decreasing. More precisely, we can say this: the function y = f (x) is said to be increasing on the interval X if on this interval a larger value of the argument corresponds
greater function value; a function y = f (x) is said to be decreasing on an interval X if on this interval a larger value of the argument corresponds to a smaller value of the function.
In the Algebra 7 textbook, we called the process of listing the properties of a function reading a graph. The process of reading a graph will gradually become richer and more interesting as we learn new properties of functions. We discussed the five properties listed above in 7th grade for the functions we studied there. Let's add one new property.
A function y = f(x) is called bounded below if all values of the function are greater than a certain number. Geometrically, this means that the graph of the function is located above a certain straight line parallel to the x-axis.
Now look: the graph of the function y = kx 2 is located above the straight line y = - 1 (or y = - 2, it doesn’t matter) - it is shown in Fig. 13. Hence, y - kx2 (k > 0) is a function bounded from below.
Along with functions bounded below, functions bounded above are also considered. A function y - f(x) is said to be bounded from above if all values of the function are less than a certain number. Geometrically, this means that the graph of the function is located below some straight line parallel to the x-axis.
Is there such a line for the parabola y = kx 2, where k > 0? No. This means that the function is not upper bounded.
So, we got one more property, let's add it to the five listed above.
6. The function y = kx 2 (k > 0) is bounded below and not bounded above.
Properties of the function y = kx 2 for k< 0
When describing the properties of this function, we rely on its geometric model - a parabola (Fig. 14).

1. The domain of definition of the function is (—oo, +oo).
2. y = 0 at x = 0; at< 0 при .
Z.у = kx 2 is a continuous function.
4. y nai6 = 0 (achieved at x = 0), unaim does not exist.
5. The function increases as x< 0, убывает при х > 0.
6.The function is limited from above and not limited from below.
Let us explain the last property: there is a straight line parallel to the x axis (for example, y = 1, it is drawn in Fig. 14), such that the entire parabola lies below this straight line; this means that the function is bounded above. On the other hand, it is impossible to draw a straight line parallel to the x-axis such that the entire parabola is located above this straight line; this means that the function is not bounded below.
The order of moves used above when listing the properties of a function is not a law, as long as it has developed chronologically this way.
We will develop a more or less definite order of moves gradually and unify it in the 9th grade algebra course.
Example 1. Find the smallest and largest values of the function y = 2x 2 on the segment: a) ; b) [- 2, - 1]; c) [- 1, 1.5].
Solution.
a) Let's build a graph of the function y = 2x2 and highlight its part on the segment (Fig. 15). We note that 1/name. = 0 (achieved at x = 0), and y max = 8 (achieved at x = 2).
b) Let's construct a graph of the function y = 2x2 and highlight its part on the segment [- 2, - 1] (Fig. 16). We note that 2/max = 2 (achieved at x = - 1), and y max = 8 (achieved at x = - 2).
c) Let's build a graph of the function y = 2x2 and highlight its part on the segment [- 1, 1.5] (Fig. 17). We note that unanm = 0 (achieved at x = 0), and y is most achieved at the point x = 1.5; Let's calculate this value: (1.5) = 2-1.5 2 = 2-2.25 = 4.5. So, y max =4.5.

Example 2. Solve the equation - x 2 = 2x - 3.
Solution. In the textbook “Algebra-7” we developed an algorithm for graphically solving equations; let us recall it.
To solve the equation f(x) = g (x) graphically, you need:
1) consider two functions y = -x 2 and y = 2x -3;
2) construct a graph of the function i/ = / (x);
3) construct a graph of the function y = g (x);
4) find the intersection points of the constructed graphs; abscis-
The sys of these points are the roots of the equation f(x) = g (x).
Let's apply this algorithm to the given equation.
1) Consider two functions: y = - x2 and y = 2x - 3.
2) Let's construct a parabola - a graph of the function y = - x 2 (Fig. 18).
3) Let's build a graph of the function y = 2x - 3. This is a straight line; to build it, it is enough to find any two points on the graph. If x = 0, then y = - 3; if x = 1,
then y = -1. So, we found two points (0; -3) and (1; -1). The straight line passing through these two points (graph of the function y = 2x - 3) is depicted in the same
drawing (see Fig. 18).
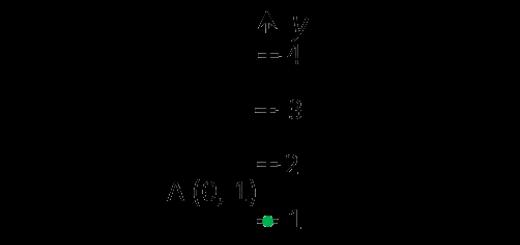
4) According to the drawing, we find that the straight line and the parabola intersect at two points A(1; -1) and B(-3; -9). This means that this equation has two roots: 1 and - 3 - these are the abscissas of points A and B.
Answer: 1,-3.

Comment. Of course, you cannot blindly trust graphic illustrations. Maybe it just seems to us that point A has coordinates (1; - 1), and on
Are they actually different, for example (0.98; - 1.01)?
Therefore, it is always useful to check yourself. So, in the example considered, you need to make sure that point A(1; -1) belongs to the parabola y = - x 2 (this is easy - just substitute the coordinates of point A into the formula y = - x 2; we get - 1 = - 1 2 - correct numerical equality) and the straight line y = 2x - 3 (and this is easy - just substitute the coordinates of point A into the formula y = 2x - 3; we get - 1 = 2-3 - the correct numerical equality). The same must be done for
points 8. This check shows that in the equation considered, graphical observations led to the correct result.
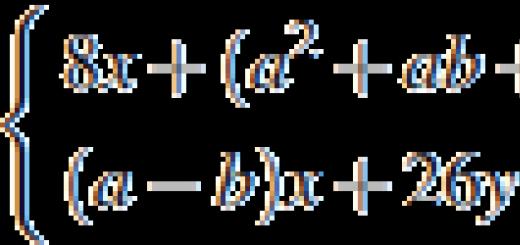
Example 3. Solve system of equations
![]()
Solution. Let's transform the first equation of the system to the form y = - x 2. The graph of this function is a parabola shown in Fig. 18.
Let us transform the second equation of the system to the form y = 2x - 3. The graph of this function is the straight line shown in Fig. 18.
The parabola and the straight line intersect at points A (1; -1) and B (- 3; - 9). The coordinates of these points serve as solutions to a given system of equations.
Answer: (1; -1), (-3; -9).
Example 4. Given a function y - f (x), where

Required:
a) calculate f(-4), f(-2), f(0), f(1.5), f(2), f(3);
b) construct a graph of the function;
c) use a graph to list the properties of the function.
Solution,
a) The value x = - 4 satisfies the condition - therefore, f(-4) must be calculated using the first line of the function definition. We have f(x) = - 0.5x2, which means
f(-4) = -0.5 .
(-4) 2 = -8.
Similarly we find:
f(-2) = -0.5 .
(-2) 2 =-2;
f(0) = -0.5 .
0 2 = 0.
The value satisfies the condition, so it must be calculated using the second line of the function specification. We have f(x) = x + 1, which means
![]() The value x = 1.5 satisfies condition 1< х < 2, т. е. f(1,5) надо вычислять по третьей строке задания функции. Имеем f (х) = 2х 2 , значит,
The value x = 1.5 satisfies condition 1< х < 2, т. е. f(1,5) надо вычислять по третьей строке задания функции. Имеем f (х) = 2х 2 , значит,
f(1.5) = 2-1.5 2 = 4.5.
Similarly we get
f(2)= 2 .
2 2 =8.
The value x = 3 does not satisfy any of the three conditions for specifying a function, and therefore f(3) cannot be calculated in this case; the point x = 3 does not belong to the domain of definition of the function. The task of calculating f(3) is incorrect.
b) We will build the graph “piece by piece”. First, let's construct a parabola y = -0.5x 2 and select its part on the segment [-4, 0] (Fig. 19). Then we construct the straight line y = x + 1 u. Let’s select its part on the half-interval (0, 1] (Fig. 20). Next, we’ll construct a parabola y = 2x2 and select its part on the half-interval
(1, 2] (Fig. 21).
Finally, we will depict all three “pieces” in one coordinate system; we obtain a graph of the function y = f(x) (Fig. 22).
c) Let's list the properties of the function or, as we agreed to say, read the graph.

1. The domain of definition of the function is the segment [—4, 2].
2. y = 0 at x = 0; y > 0 at 0<х<2;у<0 при - 4 < х < 0.
3. The function undergoes a discontinuity at x = 0.
4. The function increases on the segment [-4, 2].
5. The function is limited both from below and from above.
6. y max = -8 (achieved at x = -4); y most6 . = 8 (achieved at x = 2).
Example 5. The function y = f(x) is given, where f(x) = 3x 2. Find:
f(1), f(- 2), f(а), f(2а), f(а + 1), f(-х), f(Зх), f(x - 1),
f(x + a), f(x) + 5, f(x) + b, f(x + a) + b, f(x 2), f(2x 3).
Solution. Since f (x) = 3x 2, we consistently obtain:
f(1) =3 .1 2 = 3;
f(a) = For 2;
f(a+1) = 3(a + 1) 2 ;
f(3x) = 3.(3x) 2 = 27x 2 ;
f(x + a) = 3(x + a) 2 ;
f(x 2) +b = 3x 2 +b
f(x 2) = 3 .
(x 2) 2
F(- 2) = Z .
(-2) 2 = 12
f(2a) =З .
(2a) 2 =12a 2
F(x) =З . (-x) 2 =3x 2
F(-x)+ 5 =3x 2 +5
f(x + a) + b = 3 (x + a) 2 + b;
f(2x 3) = 3 .
(2x3)2