The earth's surface on a plane is depicted in the form of plans and maps.
Plan- a reduced similar image of limited areas of the earth's surface considered as a plane.
Map- a similar reduced image of a significant part of the earth's surface, obtained taking into account the curvature of the earth.
For the design of various kinds of structures of a linear type, special drawings are drawn up that display the relative heights of points on the earth's surface, called a profile.
Terrain profile- is a reduced image of a vertical section of the earth's surface in a given direction. Usually, terrain profiles are used for the design and construction of engineering structures of a linear type (roads and railways), in the search and exploration of mineral deposits, in agriculture during drainage and irrigation of lands.
For greater clarity and perception of information, it is customary to build profiles with different values of the horizontal and vertical scales. Usually the vertical scale is 5-10 times larger than the horizontal one. Topographic plans and maps or directly the results of geodetic surveys carried out instrumentally on the ground can serve as the initial material for constructing profiles.
Engineering geodesy provides for the preparation of special layout and executive drawings.
layout drawing serves to transfer the construction object to the terrain, which shows the position of the main points of the object determined by analytical data. executive drawing analytically displays the actual position of the elements of the object during the construction period or during its erection.
Topic 5: Scale
Scale- the ratio of the length of the line on the plan to the corresponding segment on the ground.
ü Numerical- this is a proper fraction, in the numerator of which there is one, and the denominator shows how many times the area is reduced when it is depicted on the plan.
ü Named- shows how many meters of terrain correspond to one centimeter of this drawing.
ü Linear- a graphic representation of a numerical scale, which is a scale with divisions corresponding to a numerical scale.
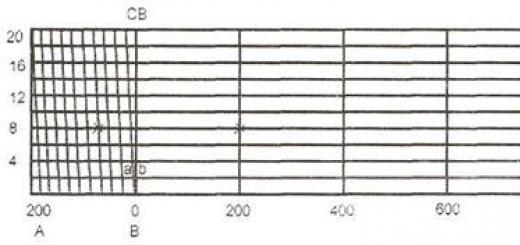
ü Transverse– It is a graph in the form of a metal ruler with a length of 10 or 12 cm, Line segment AB, equal to 2 cm and divided into 10 equal parts is called the base of the transverse scale. The graphical accuracy of determining the lengths of segments on the plan using a transverse scale is 1/100 of its base. The measurement of the lengths of lines on the plan on a transverse scale is performed using a meter (compass).

Scale Accuracy is the distance on the ground corresponding to 0.1 mm this drawing.
0.1mm - 0.1m
Topic 6: Symbols of topographic plans and maps
On topographic plans and maps, terrain objects are displayed by single conventional signs, which are divided into scale, off-scale, linear, explanatory, special.
1. Scale signs- show the location of the object and its actual size. The boundaries of such objects can be displayed as thin solid lines or dotted lines.

2 - number of storeys
K - brick
N - non-residential
2. off-scale signs- show the location of the object, but do not display its size.
Pillars - wells - detached trees
3. Linear- display the location and extent of linear objects.
|
|
|
|
4. Explanatory– show the name of AI and characteristics of objects in alphabetic and numeric notation.
5. Special- are used to display objects on special maps of various departments.
Topic 7: Relief and its representation on plans or maps
Relief- a set of irregularities of the earth's surface.
The relief is displayed on small-scale maps by color intensity, on large-scale plans by contour lines, berghashes, and absolute marks.
Contours- this is a closed curved line on the plan, all points of which on the ground have the same marks.
The shortest distance between adjacent horizontals on a plan is called - mortgage.
The vertical distance between adjacent horizontals on the ground is called - relief section height.
Bergstrokes- these are short dashes on the contour lines indicating the direction of the slope.

Main landforms:
Mountain- dome-shaped (conical) hill.
Basin- bowl-shaped depression.
Ridge- a hill that is elongated in one direction.
Hollow (log)- extended depression.
Saddle- a depression between two hills on the ridge.
ledge (terrace)- a horizontal platform on the slope of a mountain or ridge.
Topic 8: Orientation
Orientation– determination of the given direction relative to the initial one. It is customary to navigate from the northern direction of the meridian.
In geodesy, there are three meridians passing through a given point.
1. True- connects the north and south poles.
2. Magnetic- coincides with the direction of the magnetic needle of the compass.
3. Axial- coincides with the axial meridian of the given zone on the map.
The surface of the Earth is depicted on a plane in the form of plans, maps and profiles.
When drawing up plans, the spherical surface of the Earth is projected onto a horizontal plane and the resulting image is reduced to the required size. As a rule, the method of orthogonal projection is used in geodesy (Fig. 10).
Its essence lies in the fact that the points of the terrain are transferred to a horizontal plane along plumb lines parallel to each other and perpendicular to the horizontal plane.
Rice. 10. Orthogonal terrain projection
Points a, b, c, d, e are orthogonal projections of points A, B, C, D, E of the terrain on plane H.
For example point A of the terrain is projected onto the horizontal plane H along the plumb line Aa, point B - along the line Bb, etc., points a and b are orthogonal projections of points A and B of the terrain on plane H. The image of the land surface obtained on the plane is reduced from maintaining the similarity of figures.
Chapter 2. TOPOGRAPHICAL MAPS AND PLANS
2. 1. The concept and content of maps and plans
For various engineering, construction, economic and technical purposes, plans are drawn up for small areas of the area.
Terrain plan- a similar reduced image of a horizontal projection of a section of the Earth's surface with objects located on it.
Depending on the destination, plans are made contour(Fig. 11 a) and topographic(Fig. 11 b). On contour plans, conventional signs depict only the contours (outlines) of horizontal projections of local objects (roads, buildings, arable land, meadows, forests, etc.). The totality of local objects plotted on a plan is called plan situation.
On topographic plans, in addition to the situation, conventional signs depict the terrain (mountains, hollows, cliffs, etc.). According to such a plan, it is easy to read the relief and the situation of the area. For the purposes of surveying and designing railways, topographic plans are used more often than contour plans.
In contrast to the plan, maps are drawn up for large areas within a district, region, country, and the entire globe.
Map- this is an image of the Earth on a plane, reduced and distorted due to the curvature of the surface.
Rice. 11. Plans:
a - contour; b - topographic
On the plan, the contours of local objects have a similar appearance, on the map there is no exact similarity, since the spherical surface of the Earth cannot be turned onto a plane without distortion. When compiling maps, first, according to a certain law, a grid of meridians and parallels is applied to paper, and then along it - the contours of the area. Externally, the map differs from the plan in that it has a grid of meridians and parallels.
Inner frame, i.e. the frame that limits the cartographic material on topographic maps is a trapezoid, in the corners of which geographical coordinates are signed - latitude and longitude (Fig. 12).
Rice. 12. Topographic map
A minute frame is placed between the outer (decorative) and inner frame, which makes it possible to determine the geographical coordinates of points. A coordinate grid is plotted on the map sheet, the lines of which are parallel to the coordinate axes (lines of the axial meridian and equator). The coordinate grid is signed and allows you to determine the rectangular geodetic coordinates of points. The size of the side of the grid square corresponds to 1 kilometer on the scale of this map.
Above the top frame of the map sheet indicate the nomenclature of the sheet, the name of the most significant settlement and the coordinate system of the map. Under the lower frame, data are given on the declination of the magnetic needle, the convergence of meridians, the scheme of the relative position of the vertical grid line and the true and magnetic meridians, numerical and linear scales, the chart of laying, and the year of publication of the map is indicated (Fig. 13).
Rice. 13. Topographic map
In engineering geodesy, topographic maps are most often used. They are compiled on a scale of 1:10,000, 1:25,000, 1:50,000 and 1:100,000. The boundaries of the sheets of such maps are the meridians and parallels.
2. 2. nomenclature of maps and plans
Nomenclature the system of designations (numbering) of individual sheets of topographic maps (plans) is called.
The nomenclature of topographic maps of various scales is based on a 1:1,000,000 scale map, which is multi-sheeted. To obtain one sheet of a map of this scale, the entire globe is divided (Fig. 14) by meridians and parallels into columns and rows(belts).
Rice. 14. Nomenclature of maps
The meridians are drawn every 6° to the east and west, starting from the Greenwich meridian, and the parallels are drawn every 4°, to the north and south, starting from the equator. As a result, the dimensions of each sheet of such a map will be equal to 4 ° in latitude (rows) and 6 ° in longitude (columns). The nomenclature of each sheet of the 1:1,000,000 map consists of two indices: a capital letter of the Latin alphabet, which determines the latitude row - a belt, and a number corresponding to the column number. So, Moscow is on sheet N - 37.
To obtain a map at a scale of 1:500,000, a sheet of a millionth map is divided into four parts and denoted in capital letters of the Russian alphabet A, B, C, D (Fig. 15). A sheet of a map at a scale of 1:200,000 is obtained by dividing a sheet of a millionth map into 36 parts: I - XXXVI. To obtain a map sheet at a scale of 1:100,000, each map sheet at a scale of 1:1,000,000 is divided into 144 parts: 1 - 144.
Rice. 15. Formation of sheets of maps at a scale of 1: 500,000, 1: 200,000, 1: 100,000
Sheets of maps at scales 1:50,000, 1:25,000 and 1:10,000 are obtained from a map sheet at a scale of 1:100,000 by successively dividing the map sheet of the previous smaller scale into four parts and are designated for a scale of 1:50,000 by letters A, B , V, D; for a scale of 1:25,000 - a, b, c, d and for a scale of 1:10,000 - the numbers 1, 2, 3, 4. Figure 16 and Table 1 show the nomenclature and dimensions of the trapezoid sheets of maps at a scale of 1: 1,000 000 - 1:10,000.
Rice. 16. Formation of sheets of maps at a scale of 1: 50,000, 1: 25,000, 1: 10,000 and 1: 5,000
Table 1
A trapezoid at a scale of 1:5,000 is obtained by dividing each sheet of a map at a scale of 1:100,000 into 256 parts and denote them with Arabic numerals from 1 to 256 (Fig. 16). To obtain trapezoids of a scale of 1:2,000, each trapezoid of a scale of 1:5,000 is divided into 9 parts and denoted by the letters of the Russian alphabet a, b, c, d, e, f, g, h, i. The nomenclature of a trapezoid at a scale of 1:5,000 consists of the name of the corresponding sheet at a scale of 1:100,000, indicating in brackets the ordinal number of the trapezoid at a scale of 1:5,000, for example, M-38-25 (232); the nomenclature of the trapezoid in scale 1:2000 is obtained from the name of the trapezoid 1:5000 with the addition in brackets of the corresponding letter of the trapezoid in scale 1:2000, for example, M-38-5 (232-b).
According to the instructions (instructions for topographic survey at a scale of 1:5,000, 1:2,000, 1:1,000, 1:500. M., "Nedra", 1973.) for topographic plans created in areas of less than 20 km 2 , as a rule, a rectangular layout is used. This layout is based on a 1:5,000 tablet with a frame size of 40x40 cm, denoted by Arabic numerals (Fig. 17). It corresponds to 4 sheets 1:2,000, each of which is indicated by attaching one of the first four capital letters of the Russian alphabet (A, B, C, D), for example, 4-B, to the scale number 1:5,000.
Rice. 17. Laying out topographic plans
A sheet of scale 1:2,000 corresponds to 4 sheets of scale 1:1000, indicated by Roman numerals (I, II, III, IV), and 16 sheets of scale 1:500, indicated by Arabic numerals 1, 2, 3, 4, ..., 16.
The nomenclature of sheets in scales 1:1,000 and 1:500 consists of the nomenclature of a sheet in scale 1:2,000 and the corresponding Roman numeral for a sheet in scale 1:1,000 or the number of Arabic numerals for a sheet in scale 1:500.
For individual sites, the designation of sheets of topographic plans at scales of 1:1,000 and 1:500 is established in the technical design (work program).
The nomenclature of sheets of scales 1:5 000 - 1:500 and the sizes of their frames are given in Table 2.
table 2
SCALE OF TOPOGRAPHIC MAP AND PLANS
scale call the degree of reduction of the horizontal lines of the terrain on the plan.
There are numerical and graphic scales.
Numerical scale called the ratio of the length taken on the plan to the horizontal laying of the same line on the ground. It is a proper fraction, in which the numerator is 1, and the denominator m shows how many times the terrain lines are reduced when they are depicted on the plan (denoted by 1/m).
The projection of the terrain line onto a horizontal plane is called horizontal spacing.
For example, for a scale of 1/100, a unit of length on the plan corresponds to 100 of the same units on the ground, if 1 cm on the plan is 100 cm (1 m) on the ground.
For example, the denominator of the scale 1/2000 shows that the lengths of the terrain lines are reduced on the plan by 2000 times.
Knowing the length of the segment on the plan Sp, you can determine the length of the line on the ground using the formula:
Knowing the length of the line on the ground, you can calculate the length of the segment on the plan using the formula:
Example #1: the length of the line on the ground is 142 m. Find the size of the image of this segment on the plan at a scale of 1:2000.
S p \u003d 142 m / 2000 \u003d 0.071 m \u003d 7.1 cm.
Example #2: on a scale plan of 1:500, the length of the segment between two points Sp = 14.6 cm. Determine the length of this line on the ground Sm.
S m \u003d 14.6 cm 500 \u003d 7300 cm \u003d 73 m.
When solving problems on a map or plan using a numerical scale, you have to perform a lot of calculations. To avoid this, use graphic scales.
The numerical scale gives a general description of the degree of reduction and is not always convenient for practical purposes. To build plans or determine the length of segments taken from the plan, linear or transverse scales are used, which are graphic scales.
Date of: 26.10.2015
Often, especially when solving various problems, one has to deal with images of the earth's surface. These images are very different. The most common among them are drawings, plans, maps, globes, aerial photographs and space photographs.
On the image the earth's surface is depicted in its real, but reduced form from any angle of view.
Aerial photographs and space pictures, as a rule, are reduced images of a real view of the earth's surface from above.
Plans, maps and globes are reduced cartographic images of the earth's surface, since they use naming convention.
Terrain plan- this is a reduced image, made with the help of conventional signs, of a small area of \u200b\u200bthe earth's surface. Unlike photographs, small and insignificant details are not depicted on plans and maps.
Map- this is a reduced, generalized image of the earth's surface, made with the help of conventional signs and built in a certain cartographic projection.
Geographic map give a chance depict large areas of the territory and even the entire surface of the earth. However, it becomes necessary to take into account that the Earth has a spherical shape. Therefore, when depicting a spherical earth's surface on a map that is a plane, some areas have to be depicted somewhat distorted (slightly compressed or stretched).
globe is a model, i.e. reduced by tens of millions of times a copy of the Earth, so it roughly retains its shape.
On the globe, all continents, oceans, seas are shown in full accordance with their position on the globe, and the scale remains the same on the entire surface of the globe. The globe better than other cartographic images conveys the shape of our planet.
The main differences between a geographical map and a local plan
- The plan shows small areas of the earth's surface: a school site, land use of an agricultural enterprise, a settlement, etc.
- Put on the plan All objects and terrain details at a given scale. Maps through smaller scale less detailed images of the earth's surface. They display the most important objects and properties.
- When creating a plan curvature the earth's surface is not taken into account for a small value, and the earth's surface is considered a plane. All objects are shown as they really are, without distortion, their shape and outlines are preserved, only the size is reduced in accordance with the scale. While creating kart be sure to take into account the curvature (sphericity) of the Earth, so the maps inevitably present distortion.
- On the plans no graticule, and on the maps it certainly is (meridians and parallels).
On the plans north direction is considered to be the upper edge of the sheet, south - lower, west - left, east - right. The northern direction is shown additionally by an arrow with the designation north - south. On the maps, the direction north - south is determined by meridians, west - east - by parallels. They can be not only straight lines, but also arcs of various curvature, depending on the map projection.
Lesson topic:
Methods for depicting the earth's surface
5th grade

Target:
Form concepts of various ways of depicting the earth's surface.

- Educational
- - To acquaint students with the types of images of the earth's surface
- - to ensure the assimilation of the concepts of "geographic map", "plan of the area", "globe", "atlas";
- - create conditions for identifying the main differences between terrain plans and geographical maps

- Educational
- - improve the ability to work with maps and terrain plans;
- - to continue the formation of cartographic literacy;

- Educational
- - to cultivate a sense of responsibility in work, a sense of self-confidence, independence, self-control skills,
- - cultivate respect for the opinions of others, tolerance in relationships in a couple

subject
- mastering the concepts of "geographic map", "plan of the area", "globe", "atlas";
- - ability to work with a map (development of cartographic literacy);
- - the ability to identify similarities and differences between different types of images of the Earth;
- - use of acquired knowledge and skills in practical activities and everyday life for independent search for geographic information
Metasubject
- - cognitive
- the ability to define concepts, identify their main features, compare objects;
- -development of intellectual abilities
- - regulatory
- developing the ability to manage their cognitive activity, set goals;
- perform learning activities in accordance with the task;
- - communicative
- the ability to organize educational cooperation and joint activities with the teacher and peers;
- ability to work individually and in pairs

Personal
- - understanding the importance of knowledge about the ways of depicting the earth's surface for the practical life of people;
- - awareness of the need
- understand and read the map
- the desire for self-education, self-control and analysis of their actions
Universal learning activities
- - personal: realize the need to study the world around.
- - regulatory: accept and formulate a learning problem.
- - cognitive: explain the role of various sources of geographic information, identify, describe and explain the essential features of geographic objects, analyze and evaluate geographic information and draw generalizing conclusions; compose descriptions of various geographical objects based on the analysis of various sources of geographic information.
- - communicative: be able to communicate and interact with each other.

Basic concepts studied in the lesson
- aerial photograph
- globe
- plan and map
- atlases
- Cartography
Equipment:
- Globe, physical map of the world, aerial photographs of the Earth's surface and space images

I came to class like this …
I do not want anything …
I want to know everything …
And I don't care what it is …

- What shape does the earth have?
- What is the length of the Earth's equator?
- What are the two main types of motion that the earth makes?
- What is a pole?
- What is the equator?

6. What is a day?
7. Why are there 24 hours in a day?
8. What is a year?


- What is a globe model?

globe
- globe- model of the globe.
- The globe is very convenient for
imagine the shape
and surface appearance
our planet.


What can be determined using a globe?
- Sizes of continents, oceans
- Determine distance
between items.

Why is the globe not always convenient to use?
- Because of its volume
- It is not possible to show medium-sized and small objects
- Difficult to use on the road, travel

- Small areas of the earth's surface are depicted in the form of a terrain plan.

Geographic map
- Drawing of a large area of the earth's surface, made according to special rules .
The physical map of the world depicts the entire globe. A map is a flat drawing of the earth's surface.


Aerial photographs and space photographs of the earth's surface are widely used in
detailed maps and
to explore different areas
territory of the planet.


- What is a globe?
- What is a geographical map?

- How is a globe different from a map?
- Why is there more information on a geographic map? What is on the globe?

And he left the class like this ...
Great!
Understood nothing…..
I got it…..

- P. 19 (retelling)
Since ancient times, a person has had a need to convey to other people information about where he was and what he saw. Today there are various types of images of the earth's surface. All of them are small models of the world around us.
Cartography
Images of the earth's surface appeared earlier than writing. Ancient man used mammoth tusk, stone or wood for the first sketches of the area. In the ancient world, images were made on papyrus and cloth, and later on parchment. The first mapmakers were real artists, and the maps were works of art. Ancient maps resemble fabulous paintings depicting unknown countries and their inhabitants. In the Middle Ages, paper and the printing press appeared, which made it possible to mass-produce maps. The creators of the maps collected information about the Earth from the words of numerous travelers. The contents of the cards became more and more diverse. The science of maps as a special way of depicting the earth's surface, their creation and use is called cartography.
Globe - a model of the Earth
The ancient Greeks proved for the first time that the Earth is spherical. To correctly display the shape of the Earth, a globe was invented. Globe (from the Latin word globe - ball) is a three-dimensional model of the planet, reduced by many millions of times. There are no surface distortions, therefore, with its help, they get the correct idea of the location of the continents, seas, oceans, islands. But the globe is much smaller than the Earth, and it is impossible to show any area in detail on it. It is also inconvenient to use while traveling.
Plan and map
A plan is a drawing on which conventional signs are depicted in detail in a reduced form of a small one, so there is no need to take into account the curvature of the earth's surface.
A map is a generalized reduced image of the earth's surface on a plane using the system.
They have important properties. In contrast to the plans, they depict different areas but in coverage - from small areas of the earth's surface to the continents, oceans and the globe as a whole. When displaying the convex surface of the Earth on a flat sheet of paper, distortions inevitably occur in the image of its individual parts. Nevertheless, maps allow you to measure distances and determine the size of objects. They contain information about the properties of objects. For example, about the height of the mountains and the depth of the seas, the composition of the flora and fauna.
Atlases - collections of maps
An important step in the development of geographical images was the creation of atlases of map collections. These are real cartographic encyclopedias. It is believed that the first collection of maps appeared in the Roman Empire. Later, in the 16th century, the very concept of "atlas" was introduced. Geographical atlases are very diverse in terms of territorial coverage: world atlases, atlases
individual countries, regions and cities. According to their purpose, atlases are divided into educational, local history, road and others.
aerospace images
Progress in aviation and astronautics allowed man to photograph the Earth. and satellite images provide a detailed image of all the details of the terrain. But the geographical objects on them have an unusual look for us. Recognition of images in pictures is called decoding.
Today, we increasingly use maps on a computer monitor or mobile phone screen. They are created on the basis of space images using special computer programs.